
The Firing Line
Founders who expect full results on day one end up firing salespeople who were actually right on schedule.
Save this chart Download
The mechanism
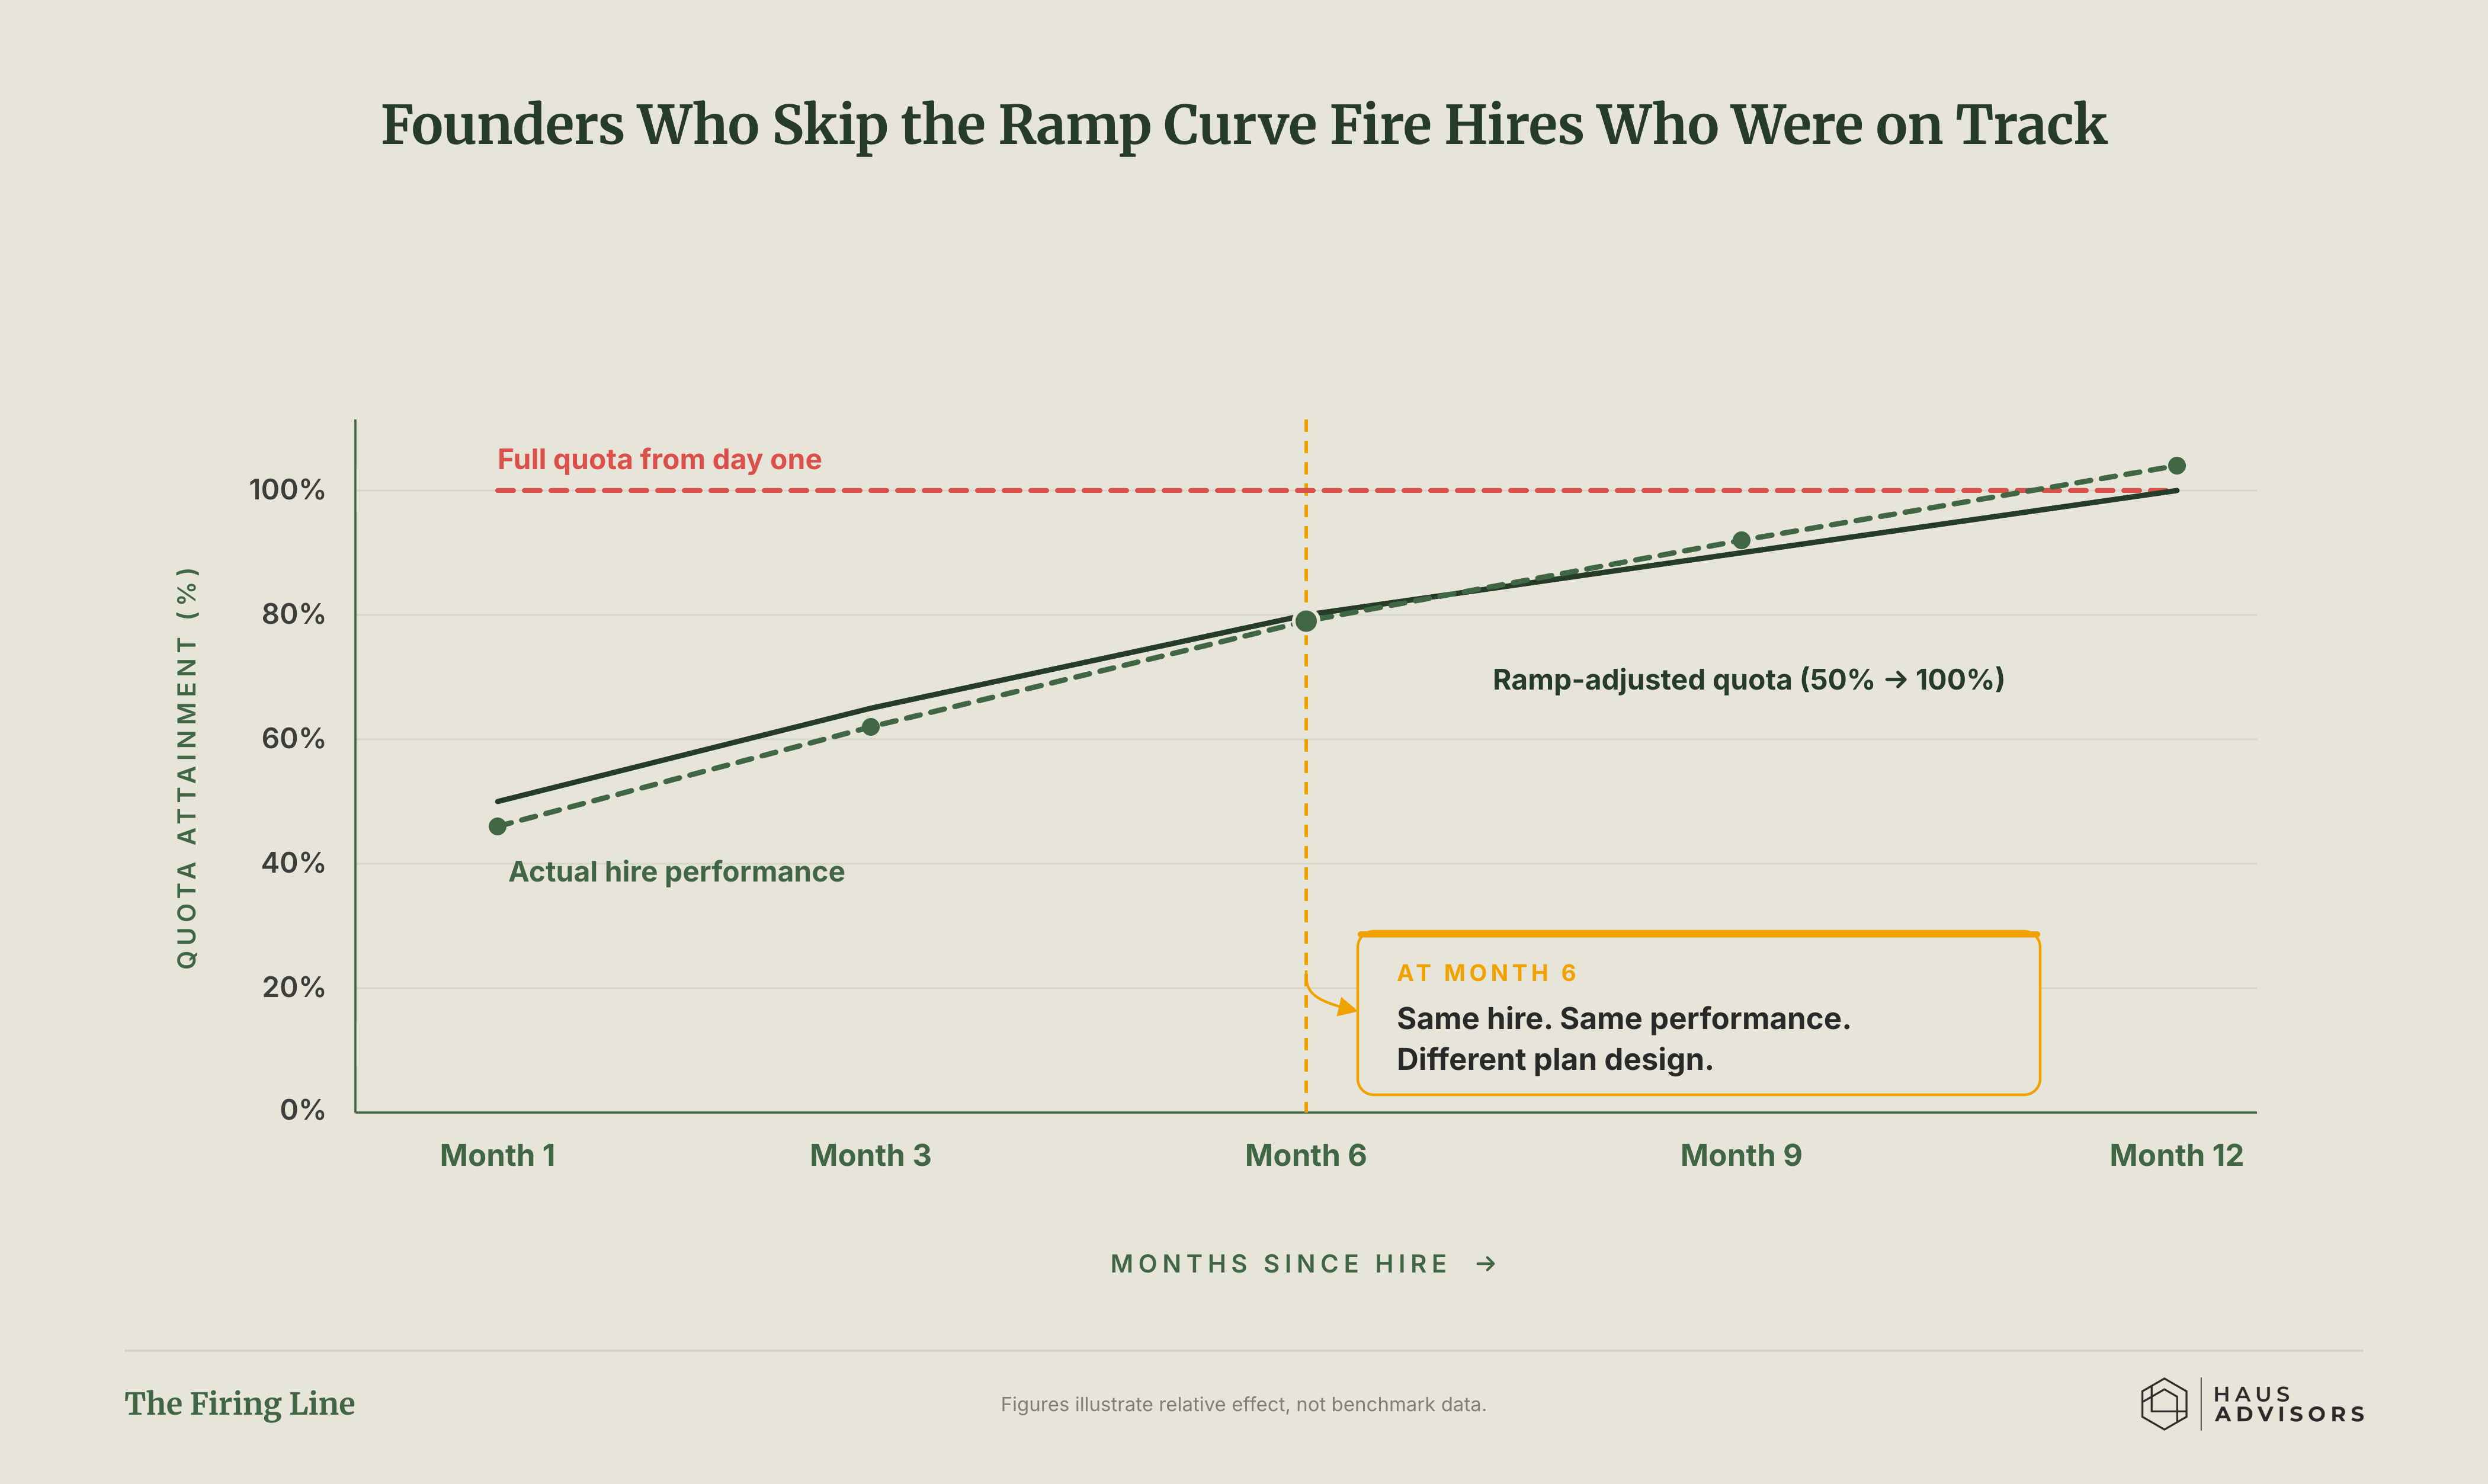
The chart tracks a new salesperson's results over twelve months. A red dashed line sits flat at full quota from day one - the unfair expectation. A green line shows a fair ramp that climbs from 50% to 100% over the year, and the hire's real results track right along it. At month six the same performance looks like failure against one plan and success against the other. Same hire, same work - the only difference is how the plan was designed.
Part of Persistence. Infrastructure that keeps growth compounding past founder heroics.