
The Role-by-Role Utilization Map
Setting one billable-time target for the whole firm mismanages almost everyone in it.
Save this chart Download
The mechanism
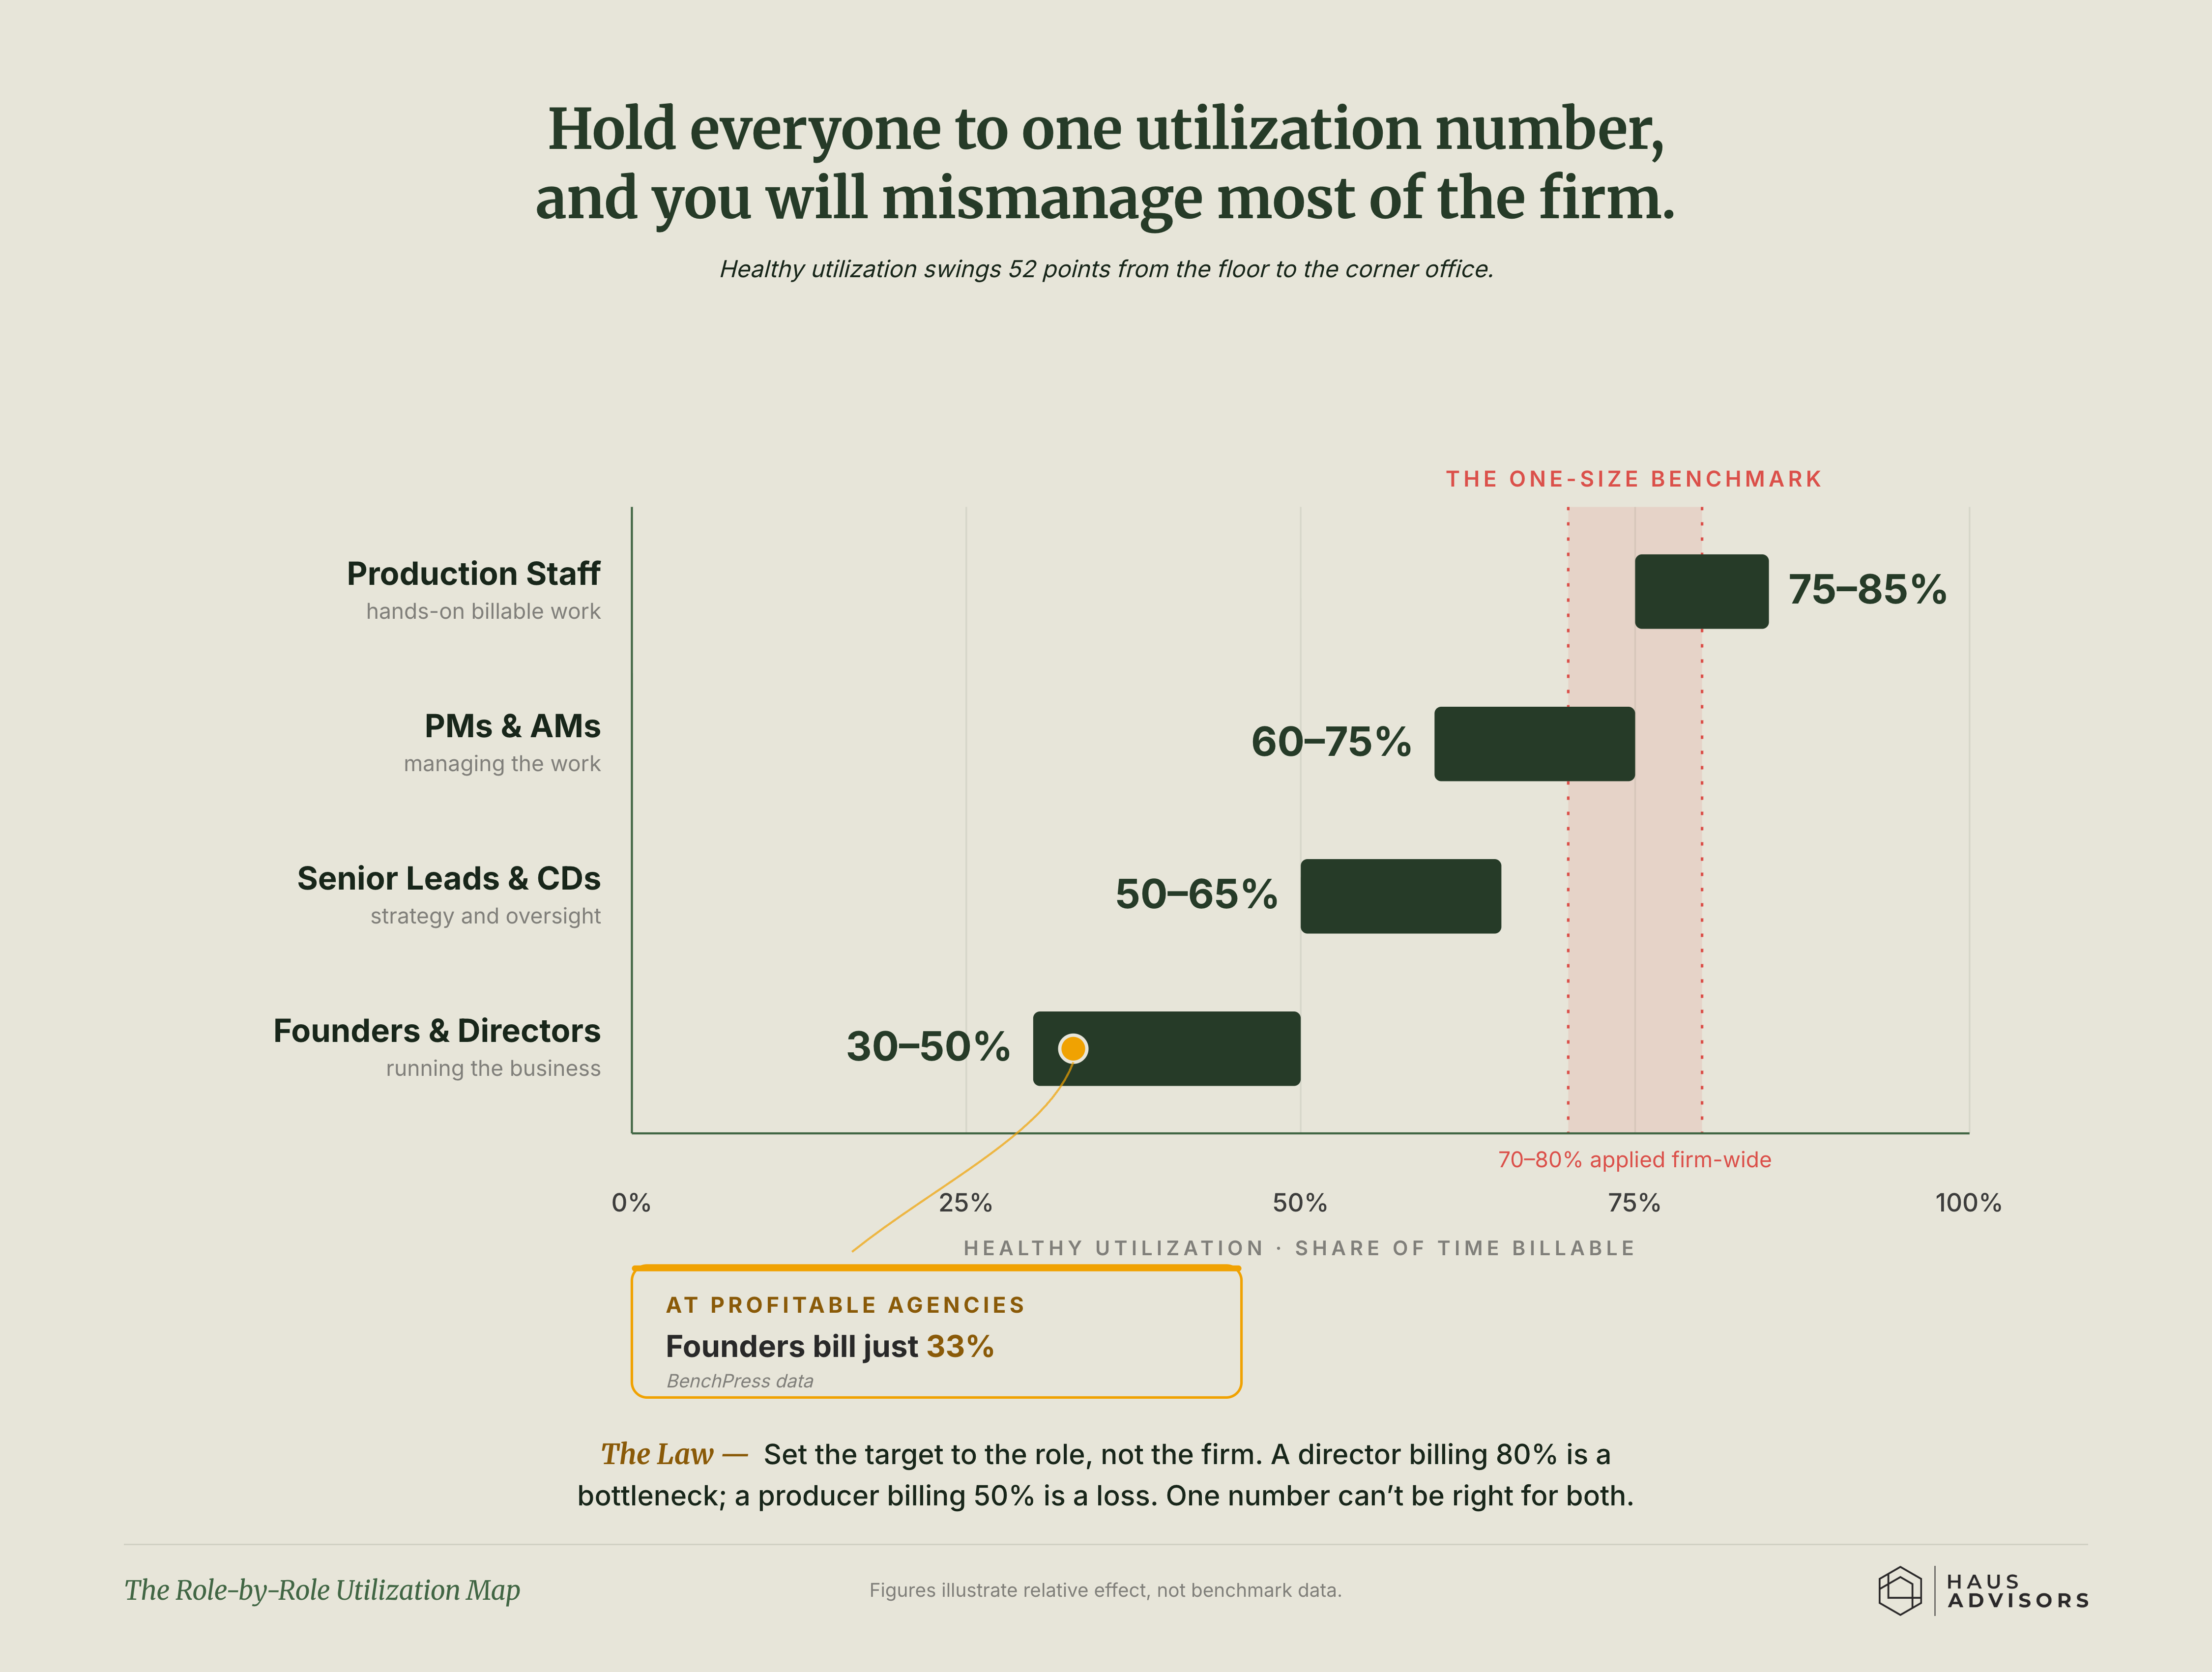
Four green bars show how much of each role's time should be paid client work: production staff highest at 75–85%, then project managers, then senior leads, and founders lowest at 30–50%. A red shaded band marks the single one-size target of 70–80% that many firms apply to everybody. A note points out that at healthy agencies, founders do paid work only about a third of their time. The right amount of paid work is different for each role, so holding a director to a producer's number breaks the business either way.
Part of Persistence. Infrastructure that keeps growth compounding past founder heroics.