
The whole vault
Every chart explains one mechanism. Start with what's going on, or search the full text.
Partnerships
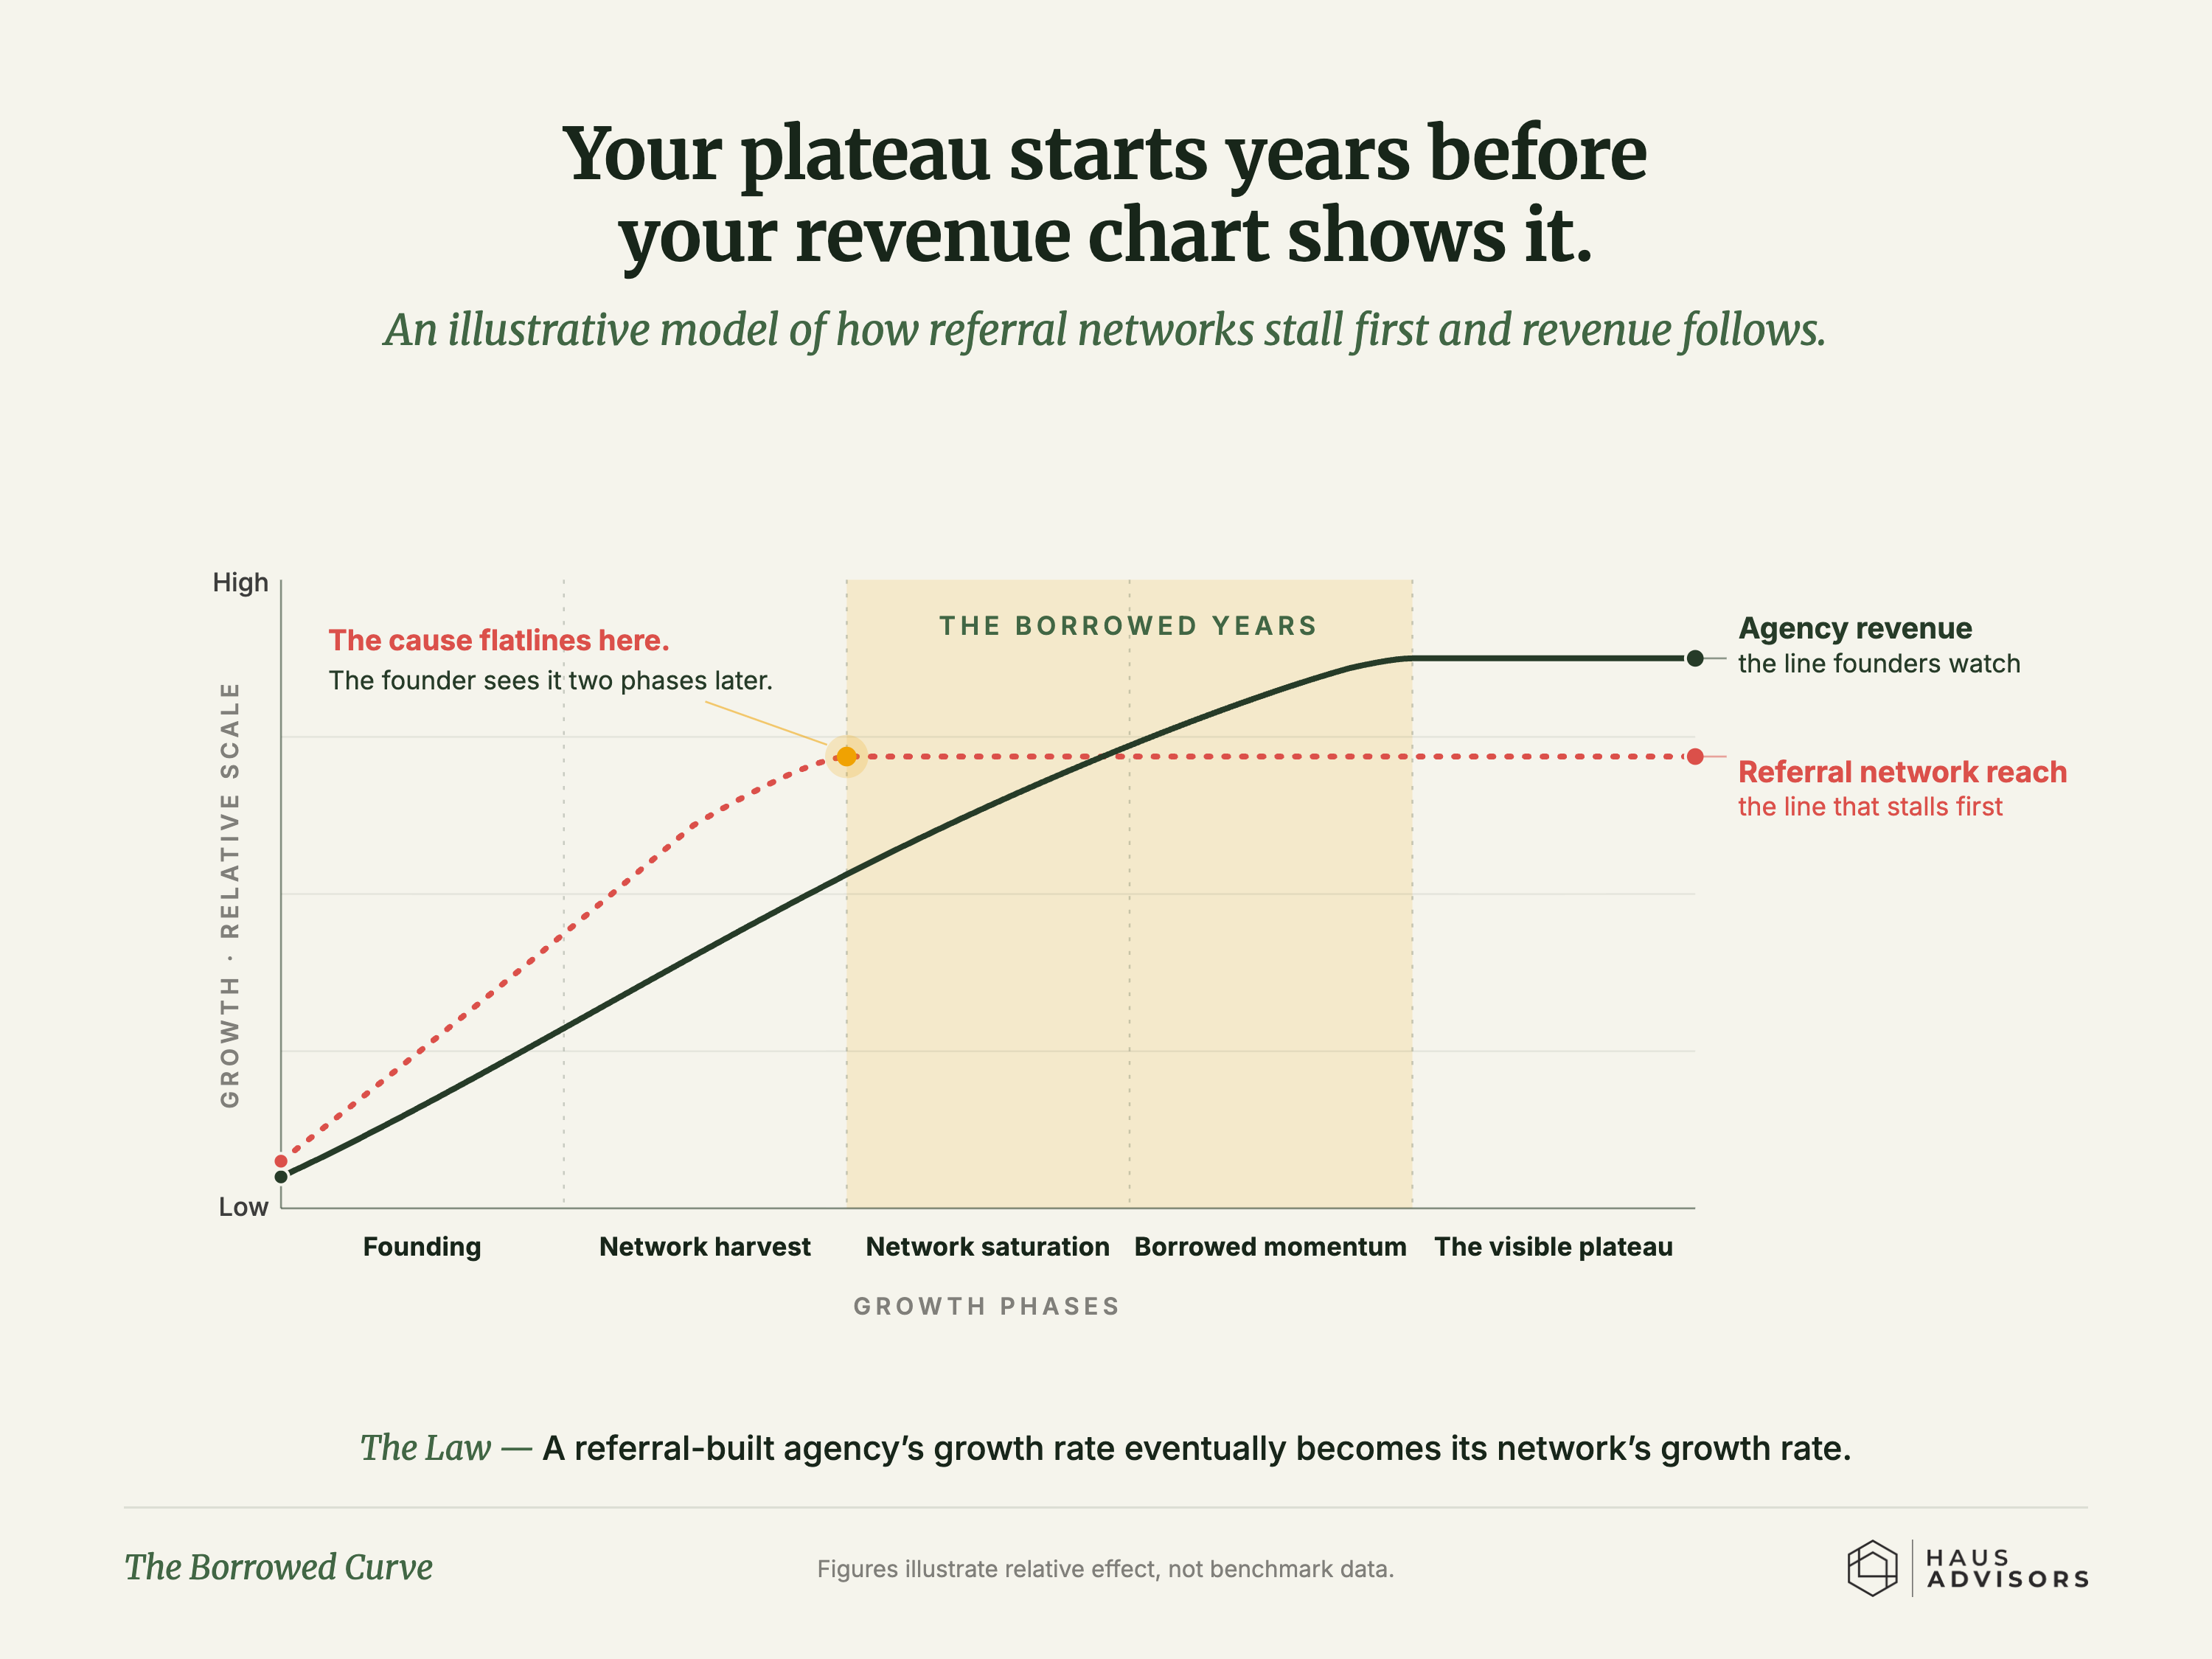
The Borrowed Curve
A referral-built agency stops growing years before its revenue chart shows it, because the network quietly maxes out first.
Partnerships
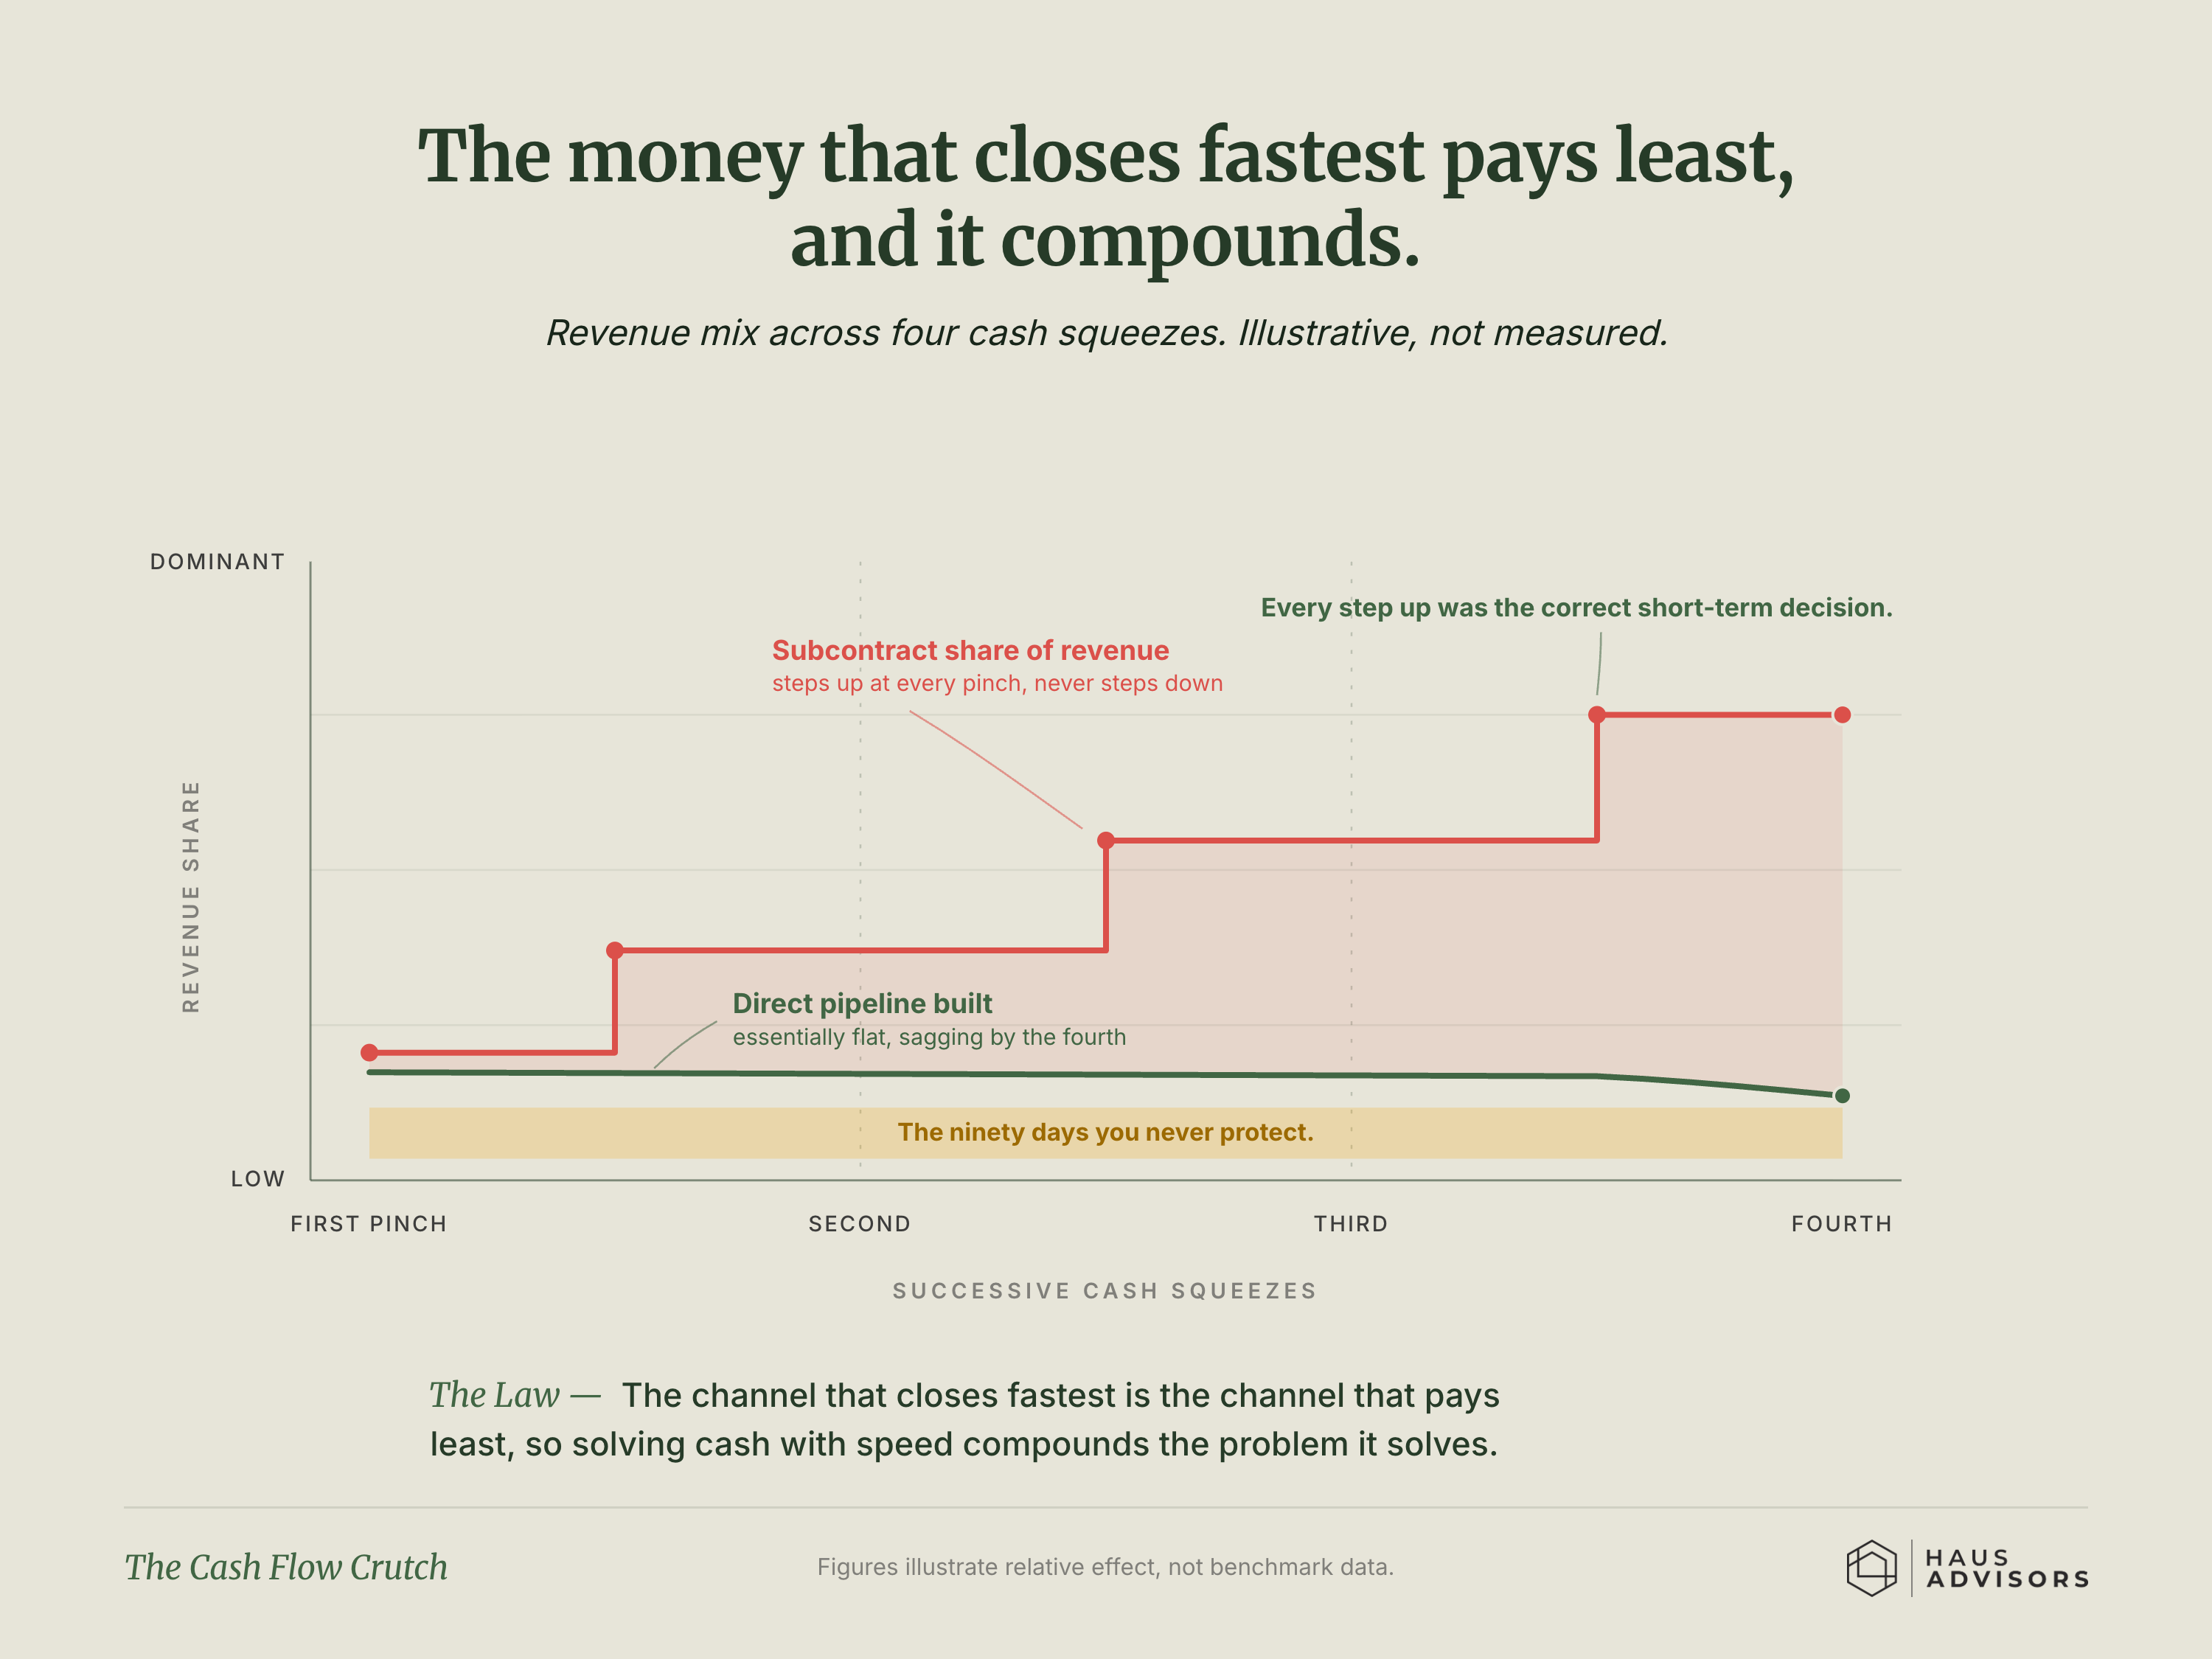
The Cash Flow Crutch
The work that pays cash fastest pays the least, and leaning on it grows every time money gets tight.
Partnerships
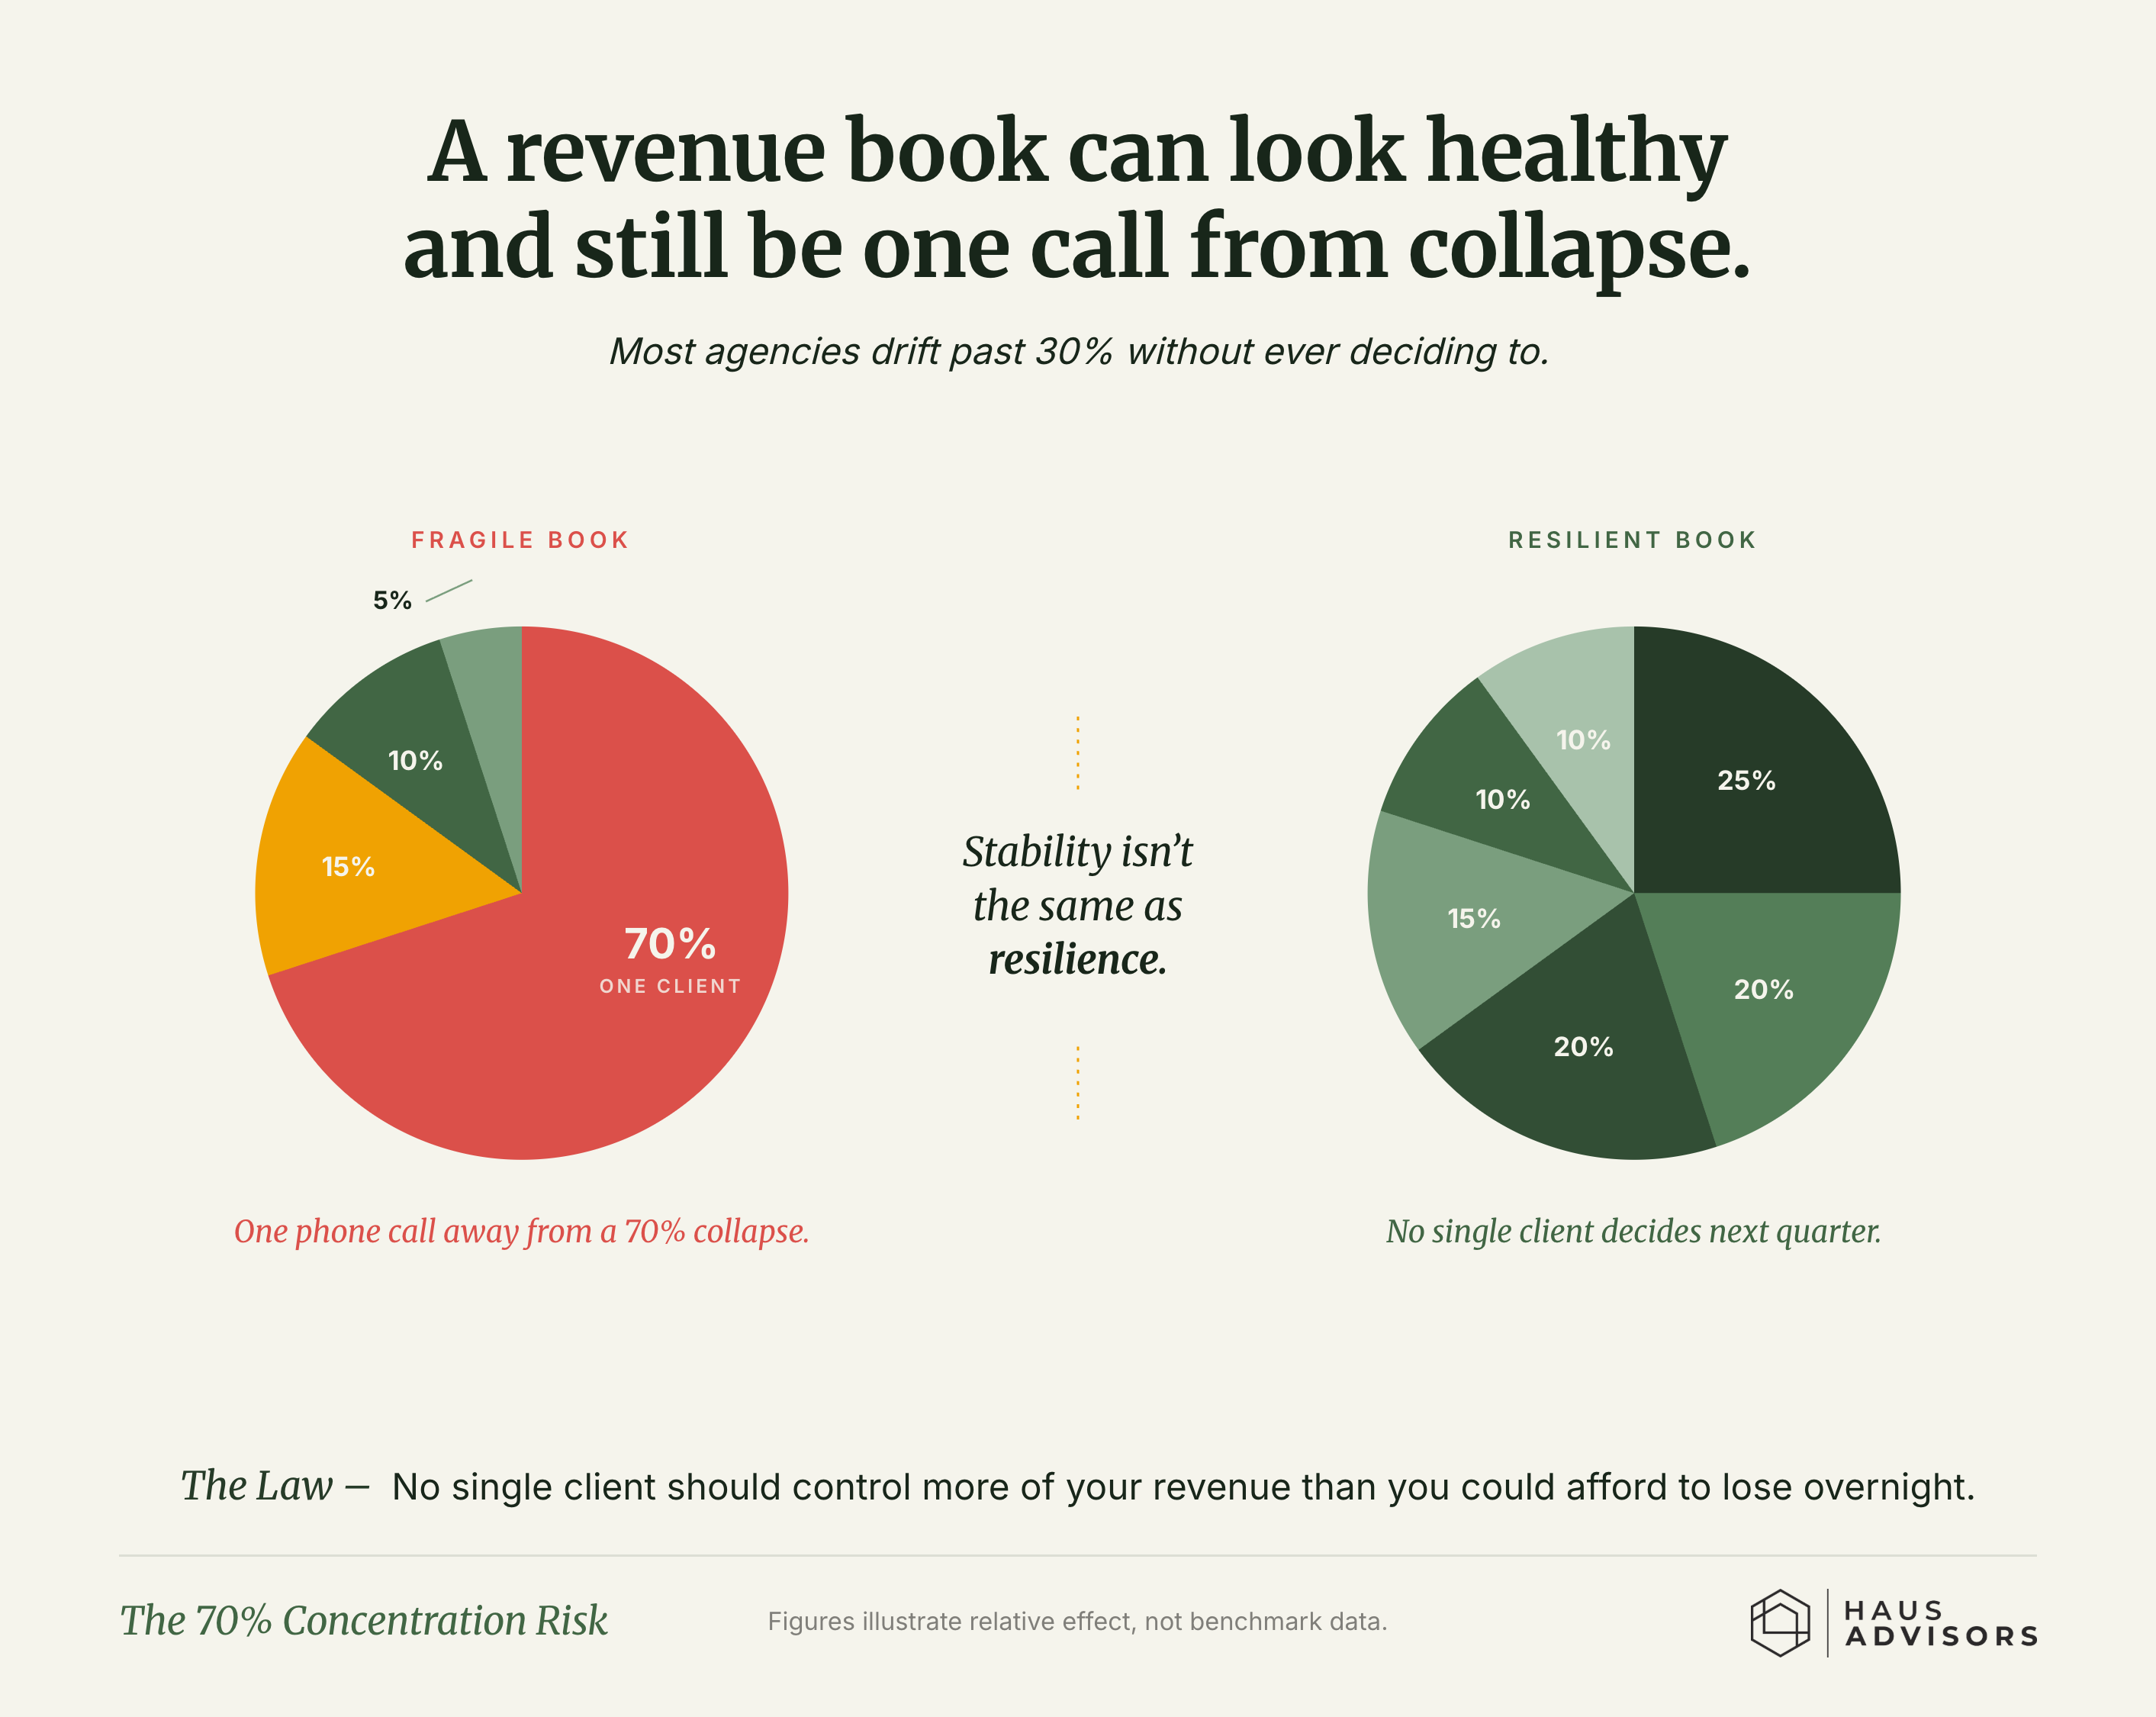
The 70% Concentration Risk
A revenue book that leans on one big client can look healthy and still be one phone call from falling apart.
Partnerships
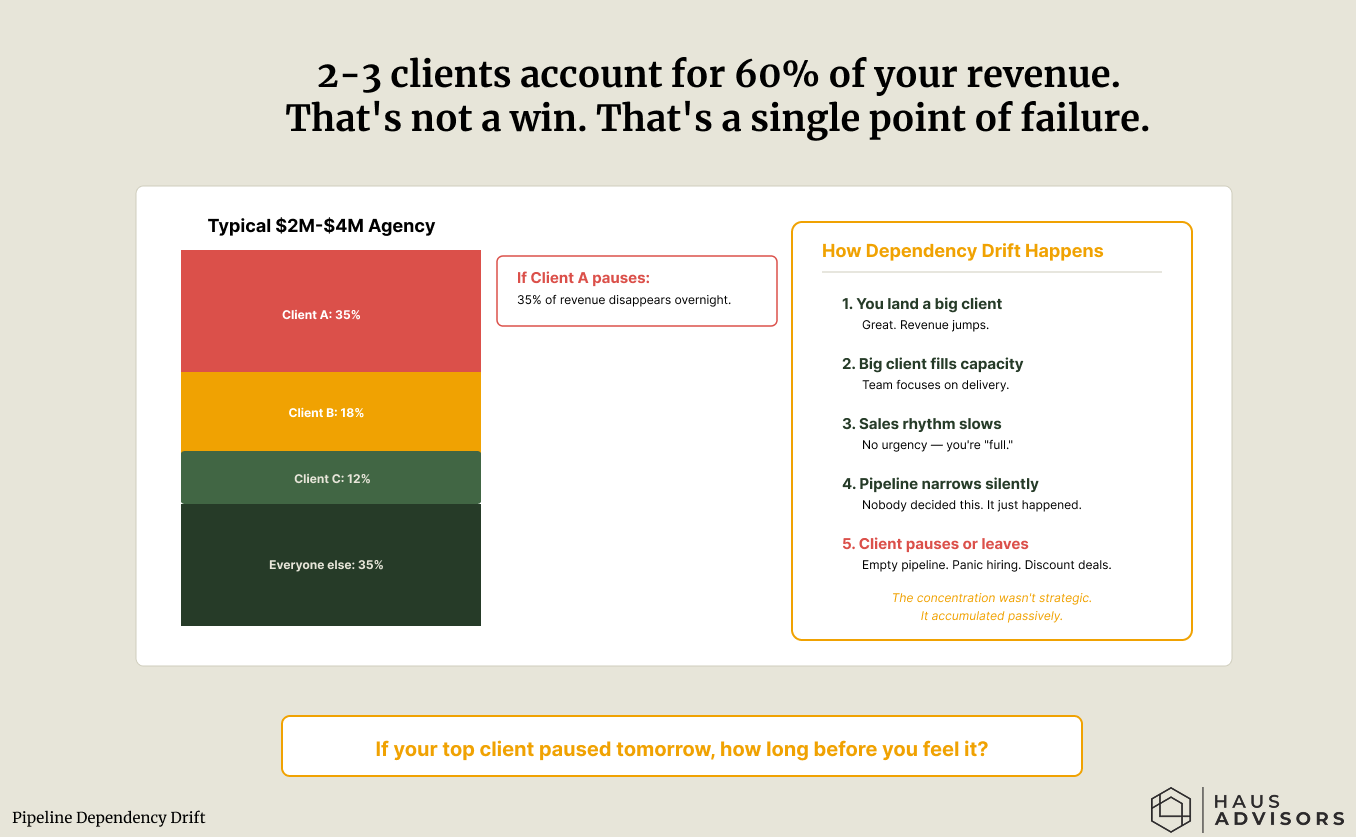
Pipeline Dependency Drift
When two or three clients make up most of your revenue, that's not a win - it's one thing that can break the whole business.
Partnerships
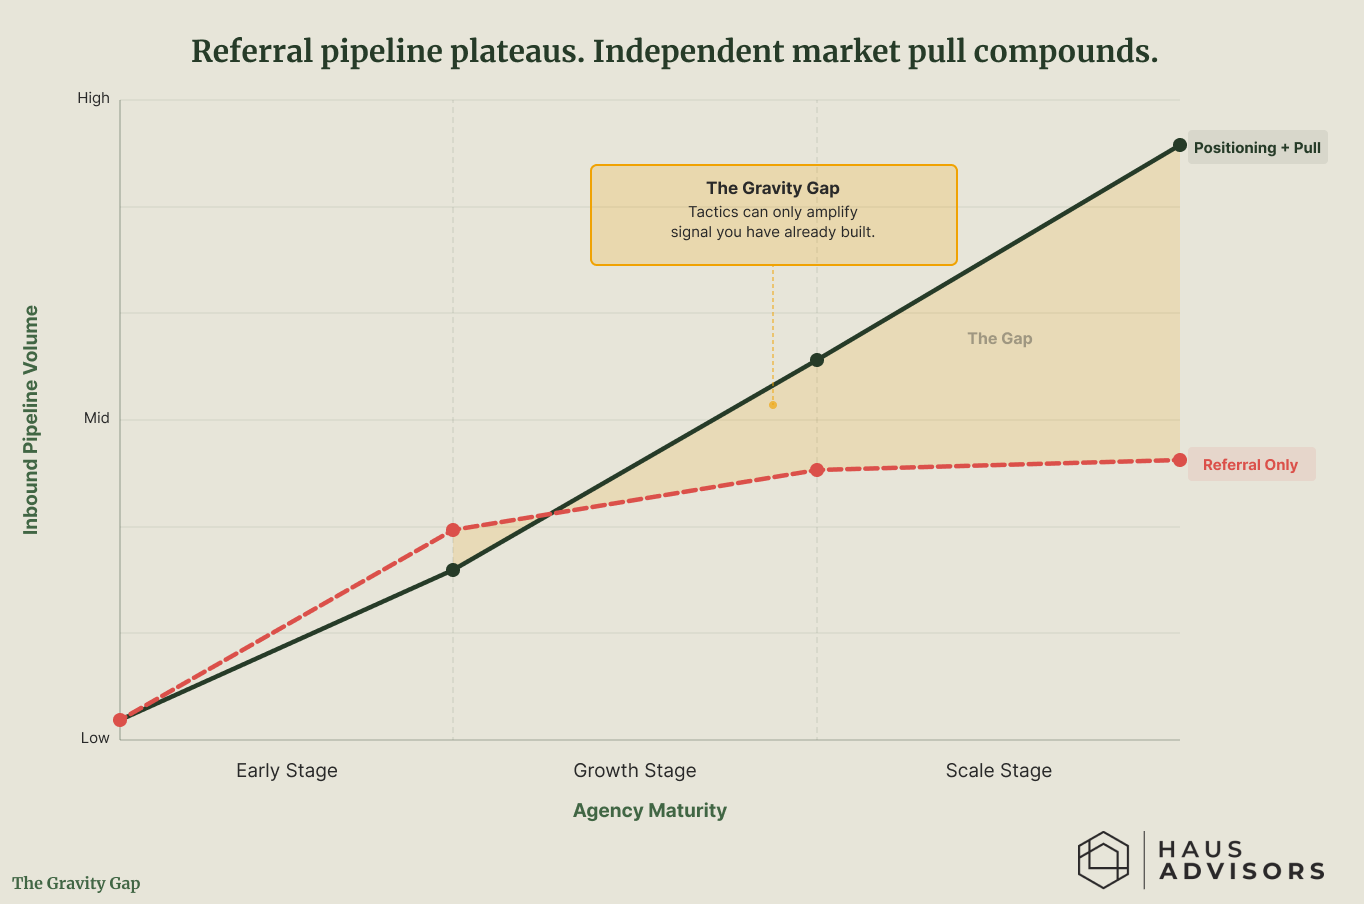
The Gravity Gap
Referrals stop growing after a while. Being known in your market keeps growing - and the gap between the two keeps widening.