
The whole vault

Every chart explains one mechanism. Start with what's going on, or search the full text.
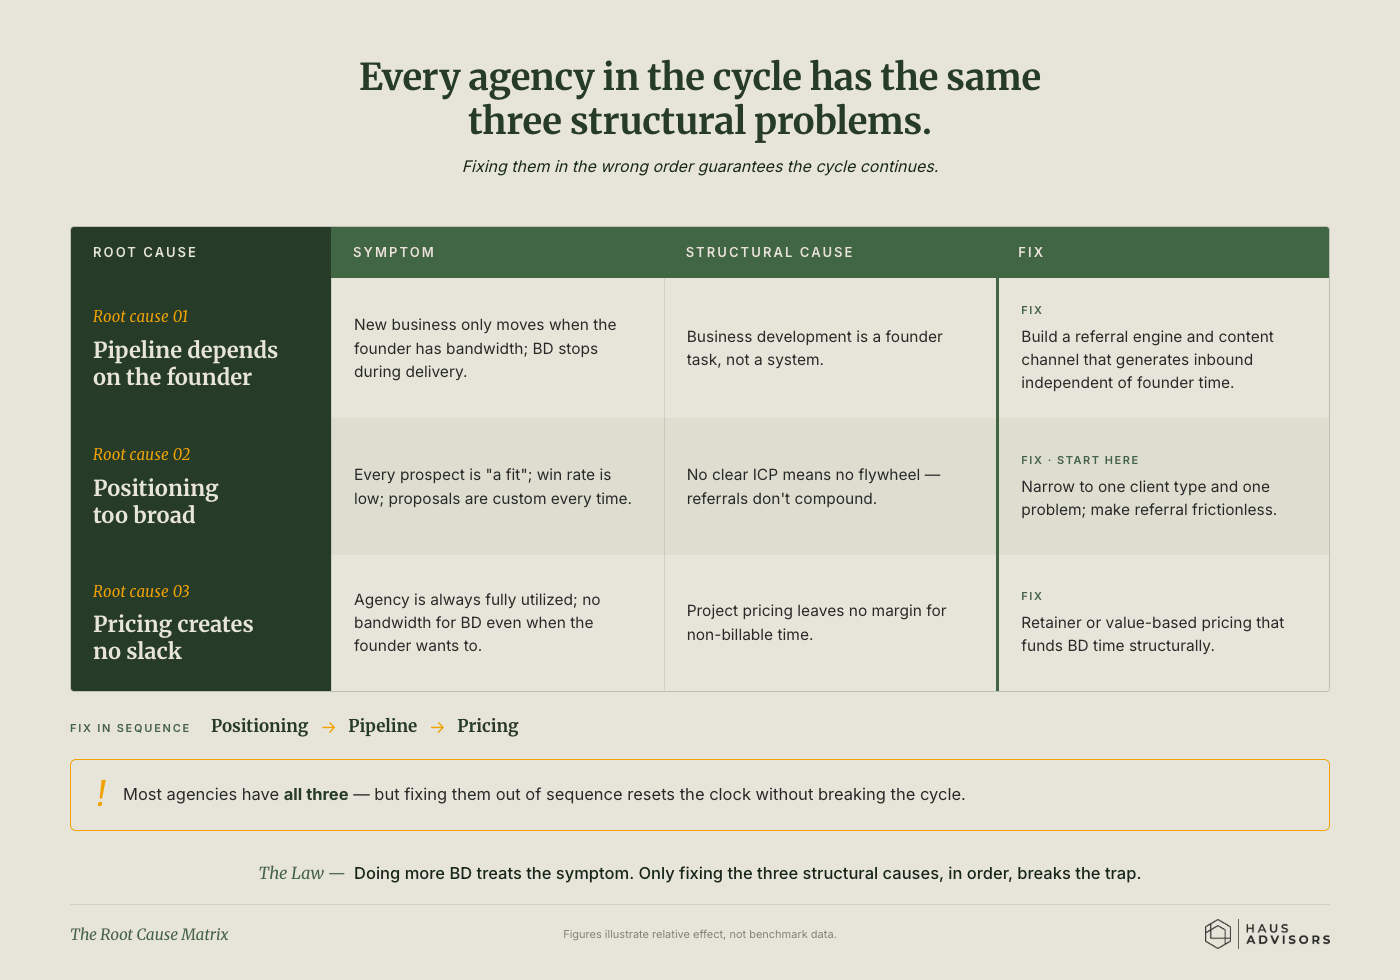
Chart: The Root Cause Matrix. Agencies stuck in the same loop share three structural problems, and fixing them out of order keeps the loop going.
Persistence

The Root Cause Matrix

Agencies stuck in the same loop share three structural problems, and fixing them out of order keeps the loop going.

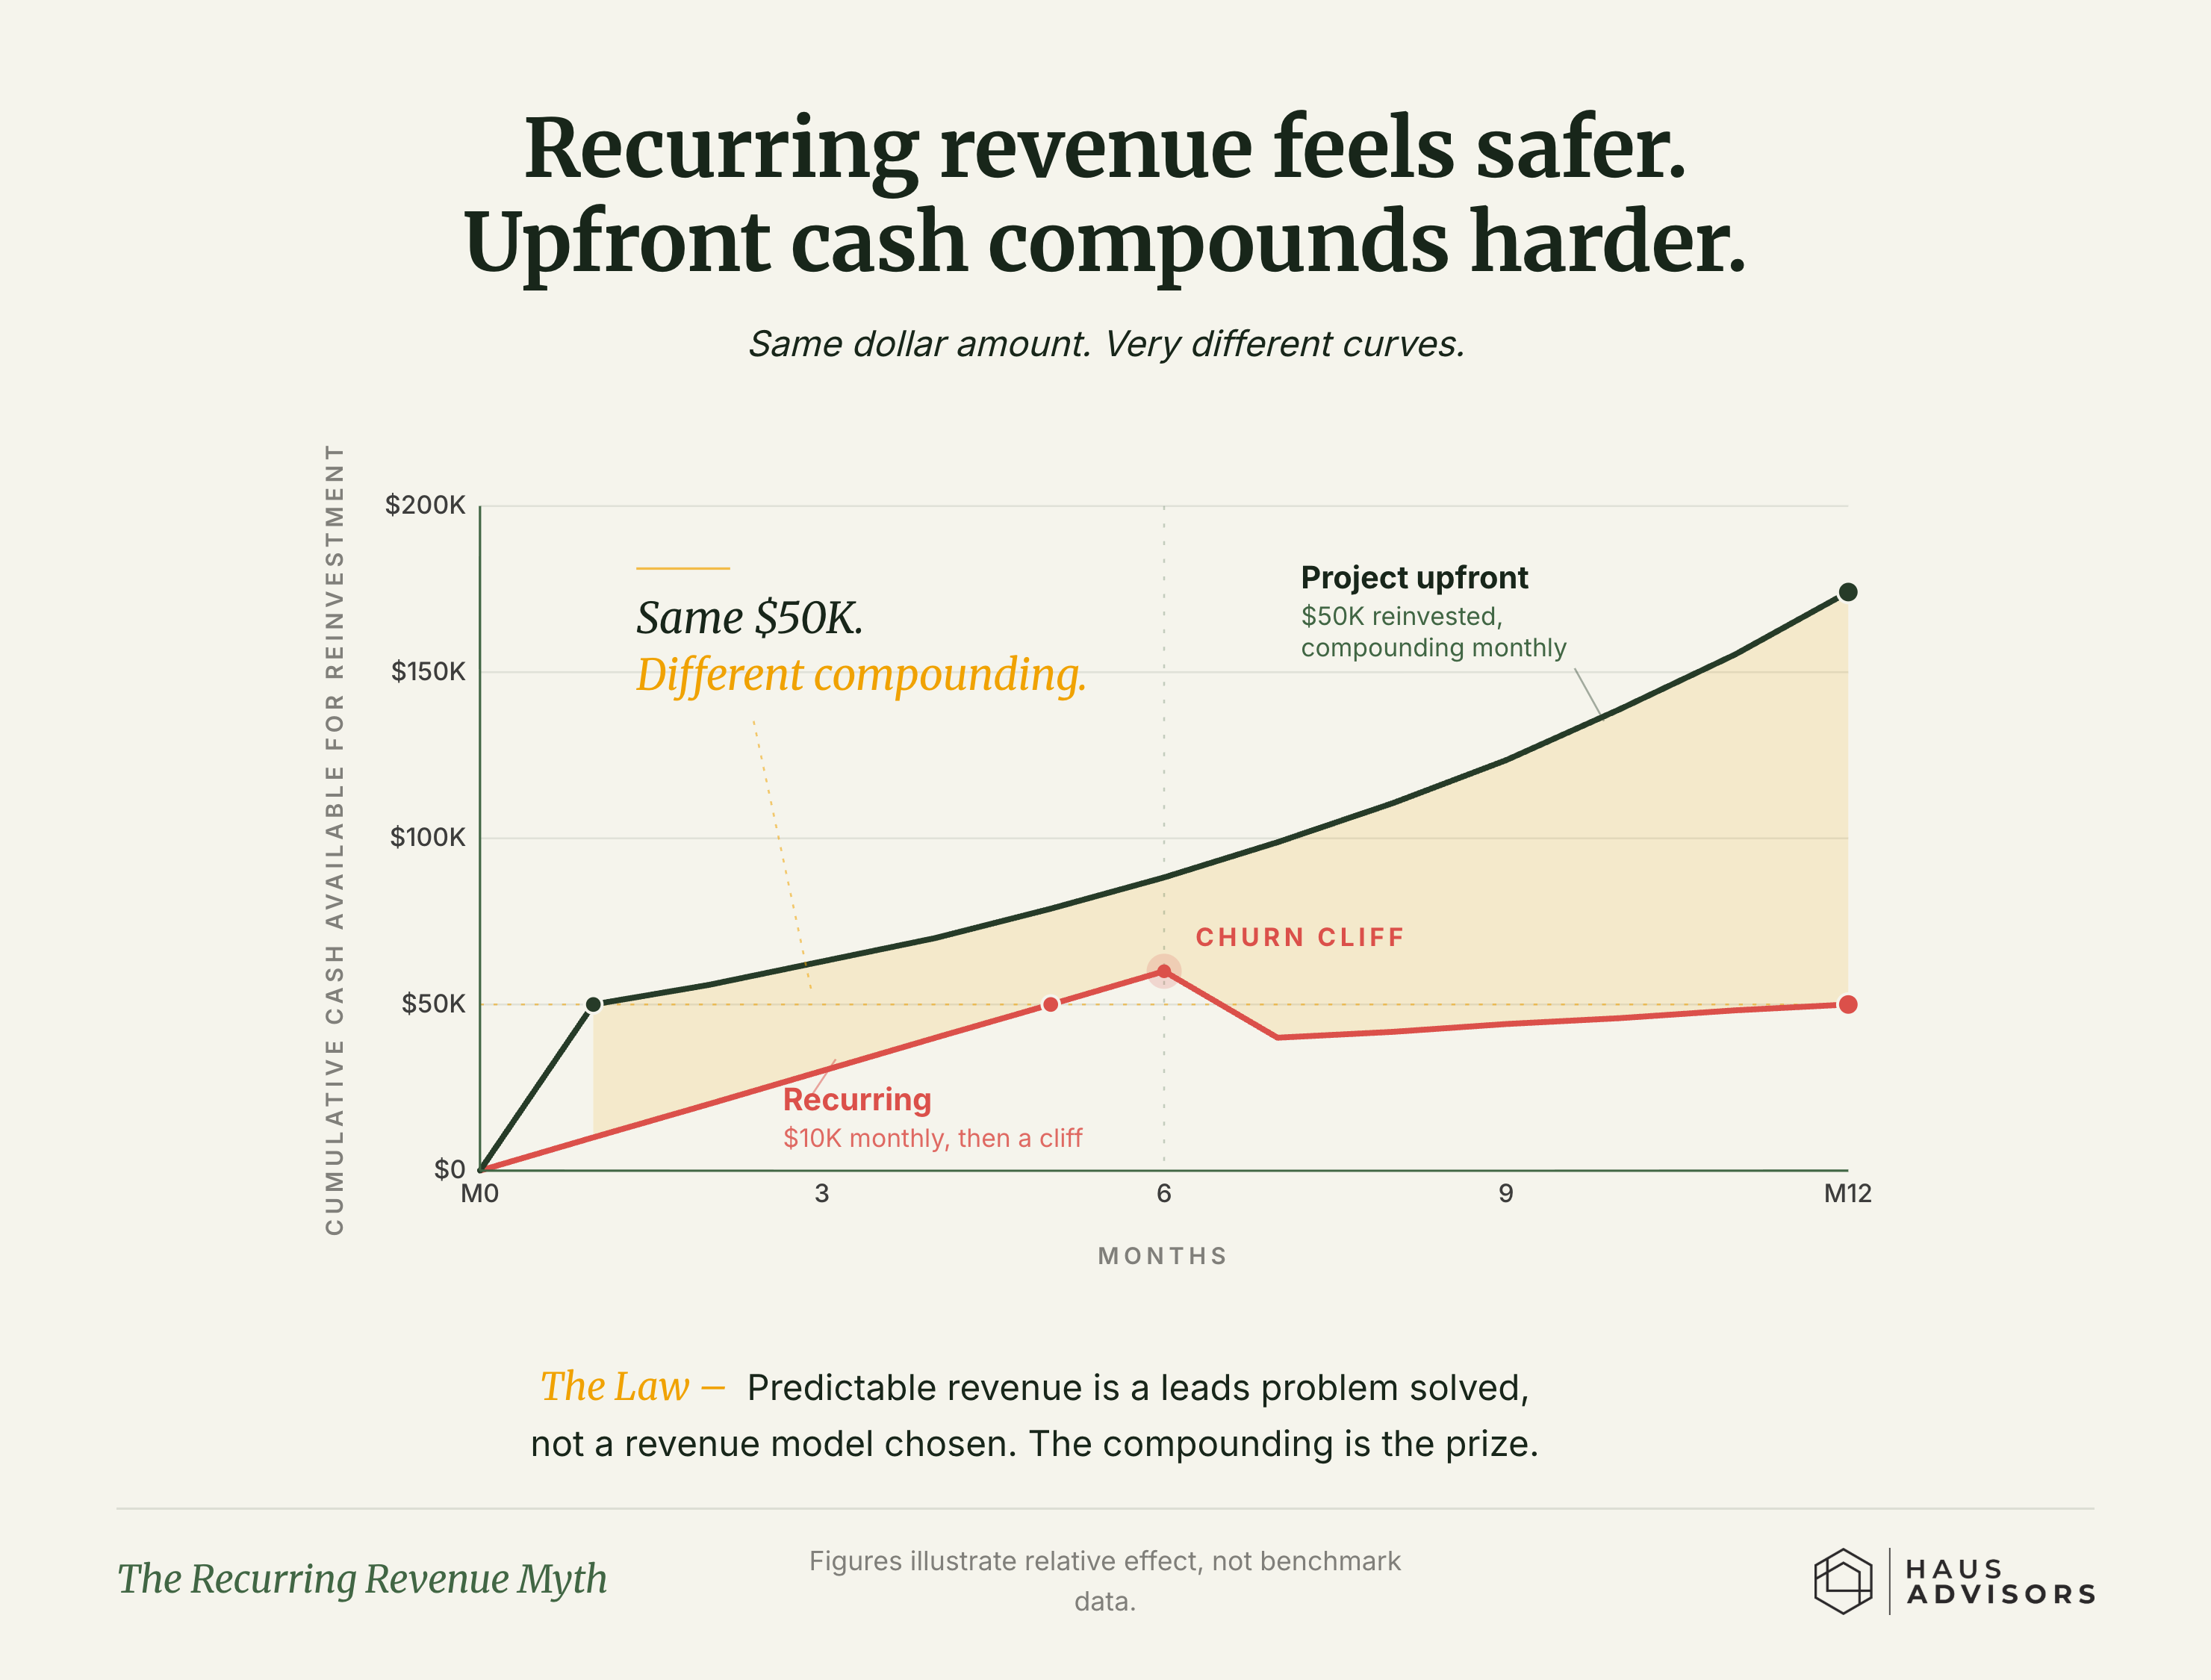
Chart: The Recurring Revenue Myth. Recurring revenue feels safer, but the same dollars taken upfront and put back to work grow into far more.
Productization

The Recurring Revenue Myth

Recurring revenue feels safer, but the same dollars taken upfront and put back to work grow into far more.

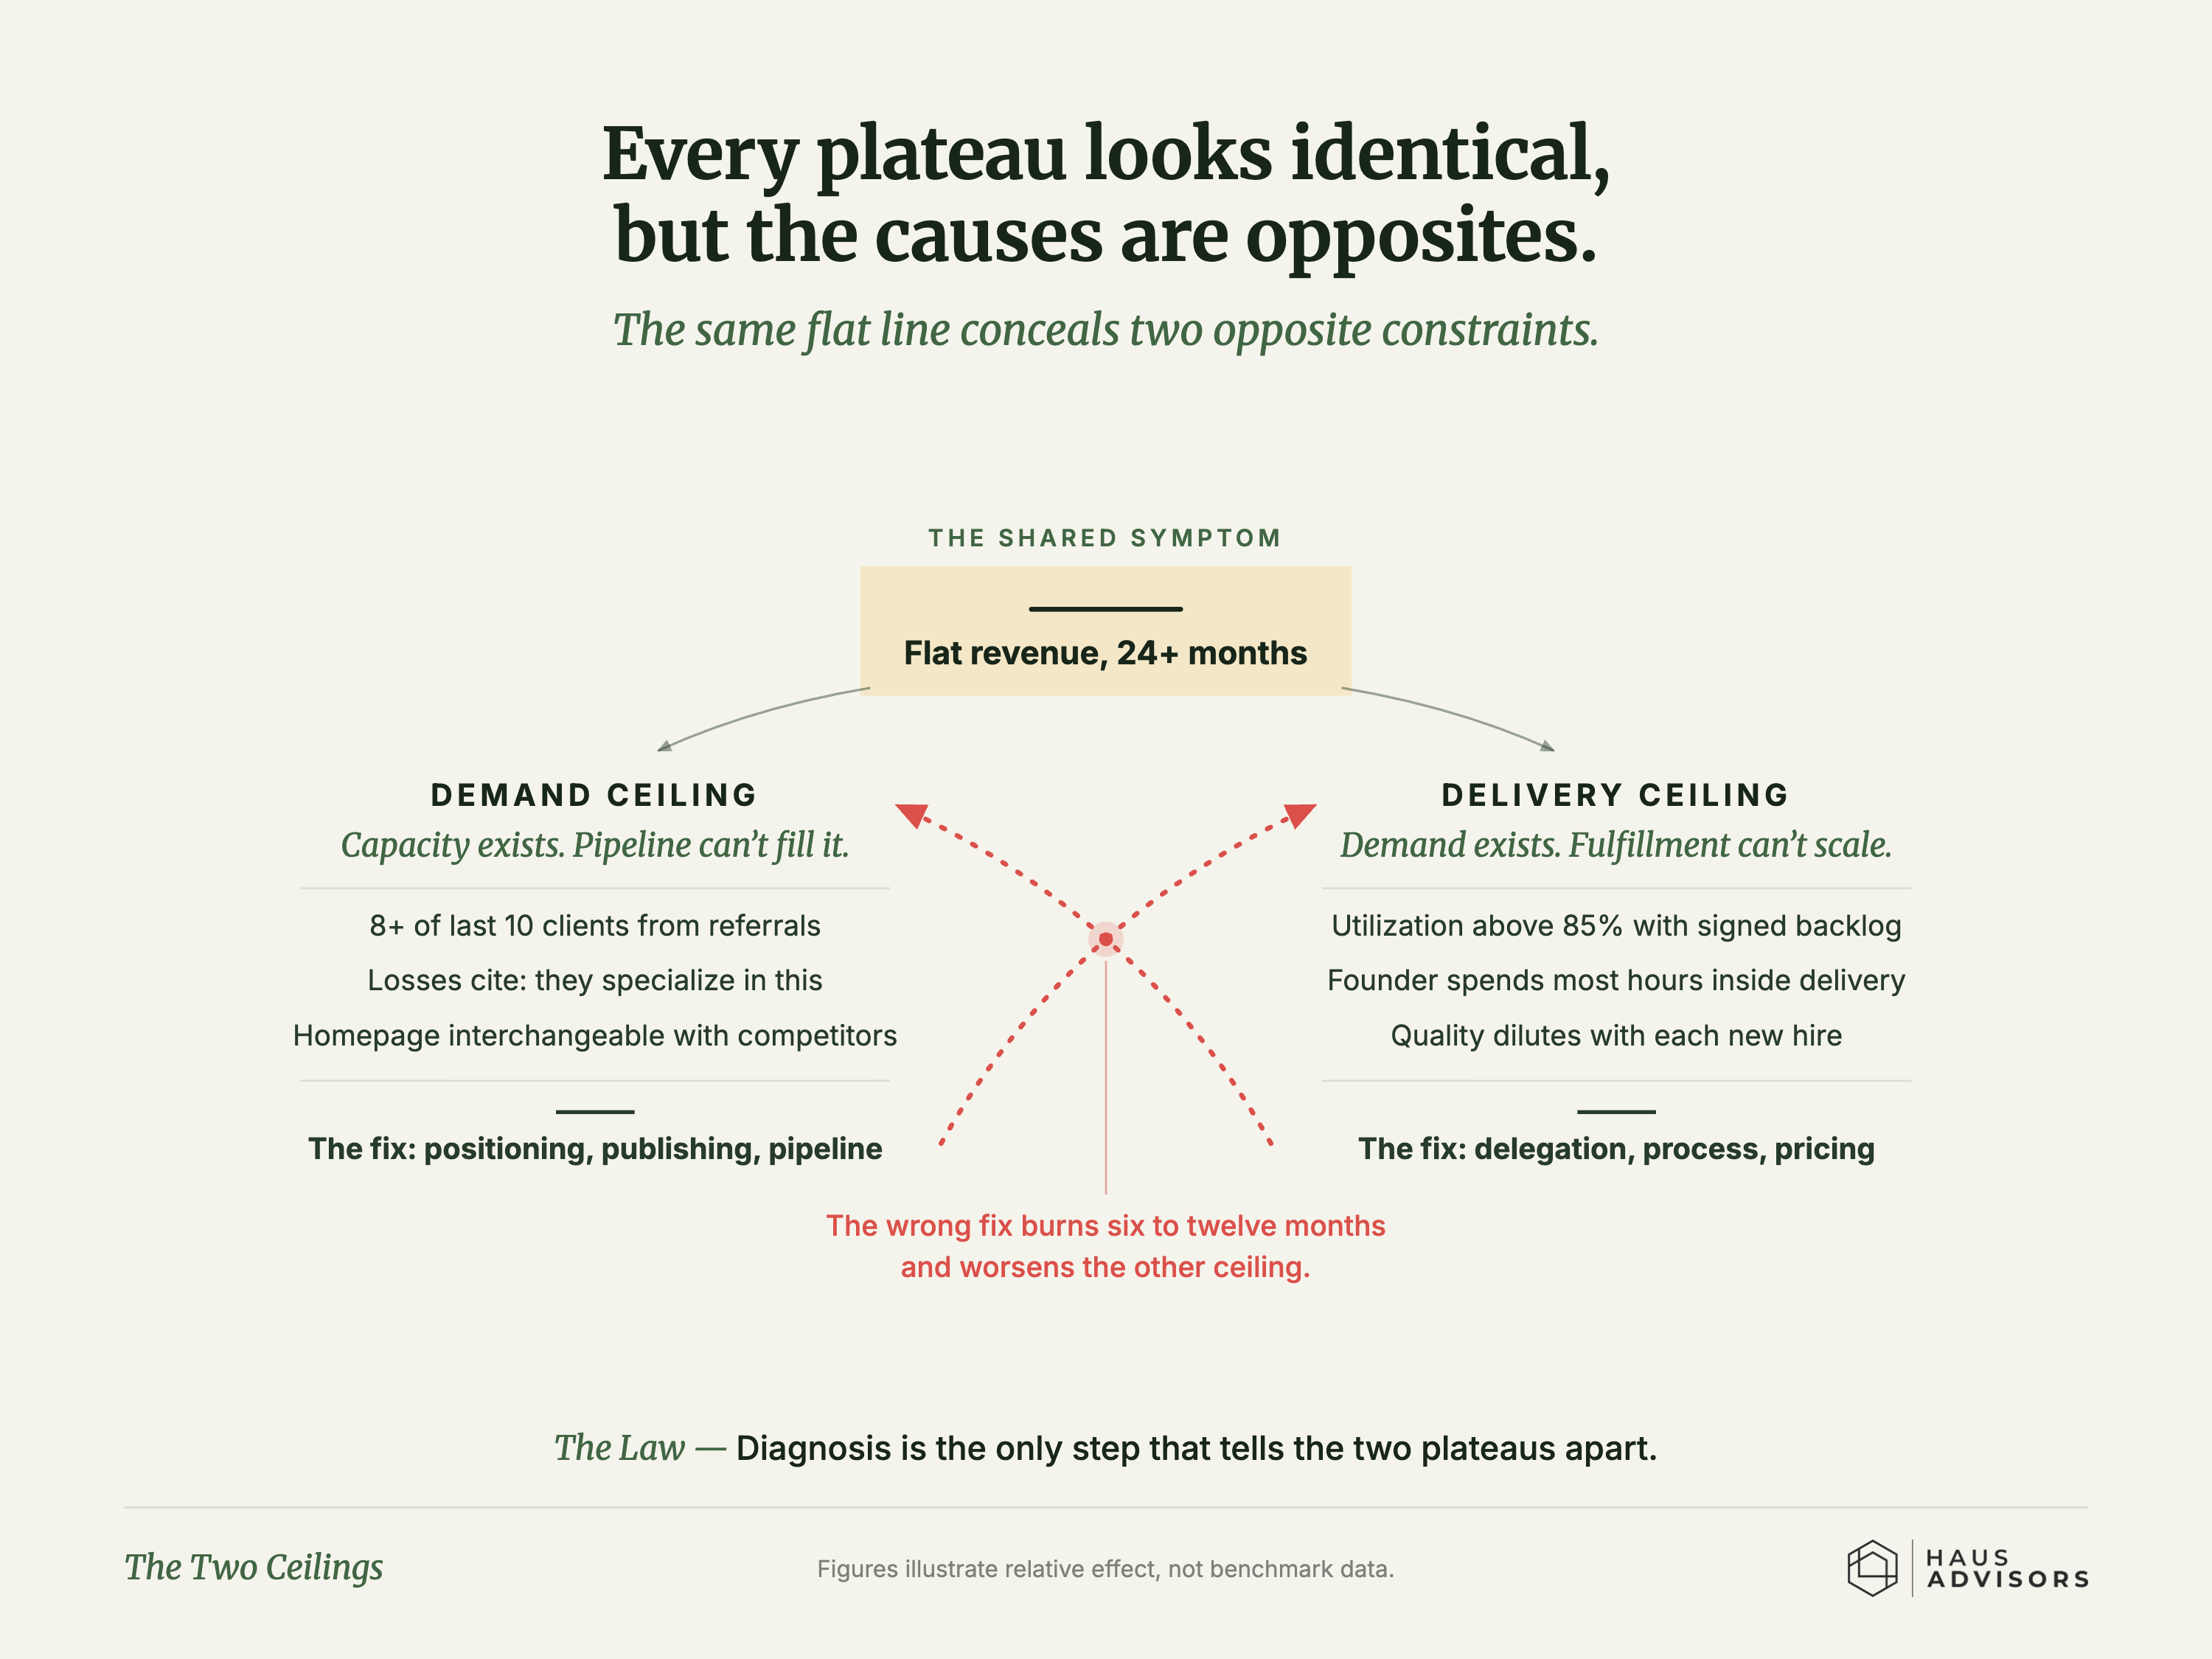
Chart: The Two Ceilings. Two very different problems can produce the exact same flat revenue, so the same plateau needs opposite fixes.
Persistence

The Two Ceilings

Two very different problems can produce the exact same flat revenue, so the same plateau needs opposite fixes.

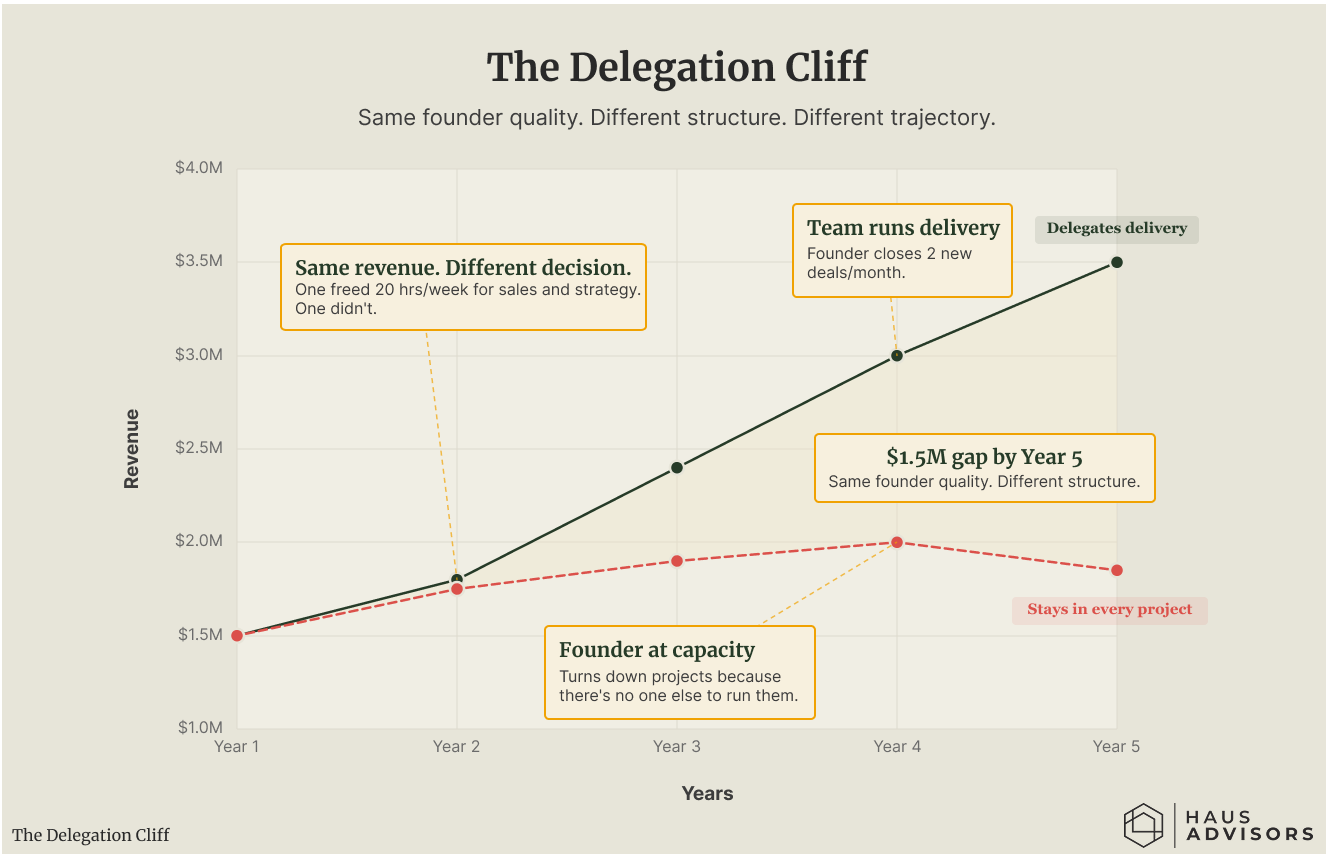
Chart: The Delegation Cliff. Two founders of equal skill split apart on growth based only on whether they hand off the delivery work.
Persistence

The Delegation Cliff

Two founders of equal skill split apart on growth based only on whether they hand off the delivery work.

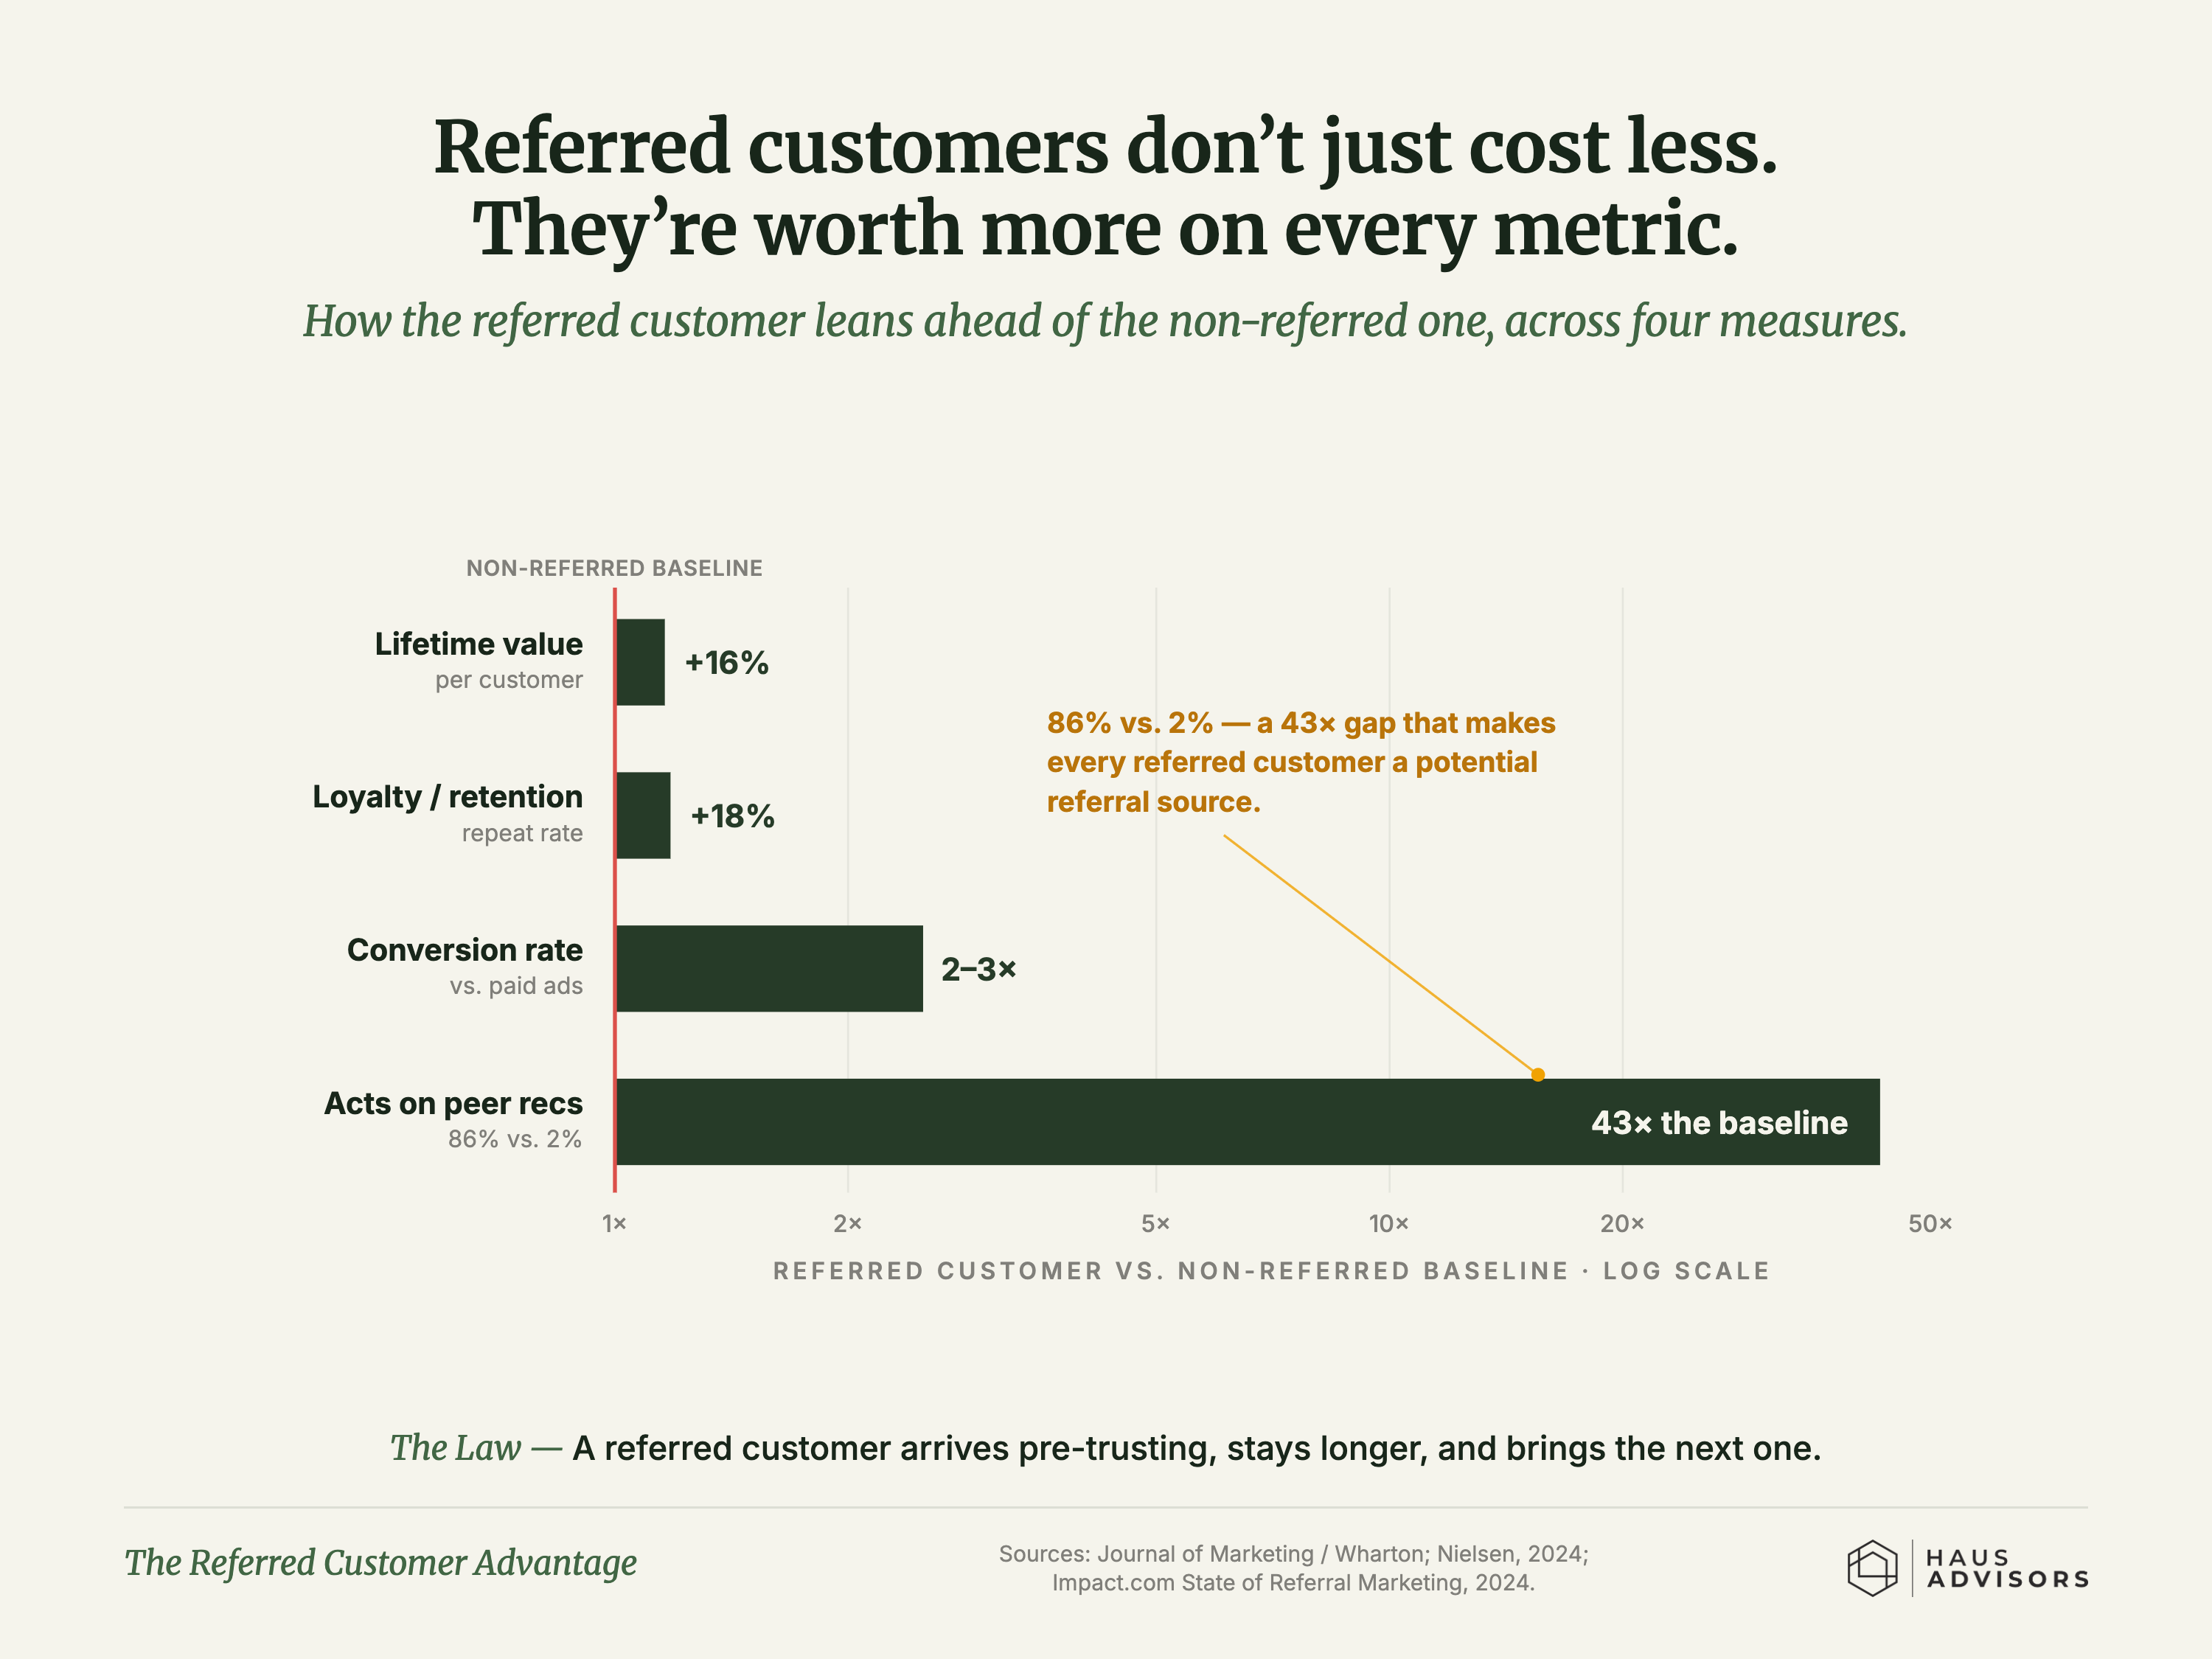
Chart: The Referred Customer Advantage. A referred customer isn't just cheaper to win - they're worth more on every measure and bring the next one.
Partnerships

The Referred Customer Advantage

A referred customer isn't just cheaper to win - they're worth more on every measure and bring the next one.

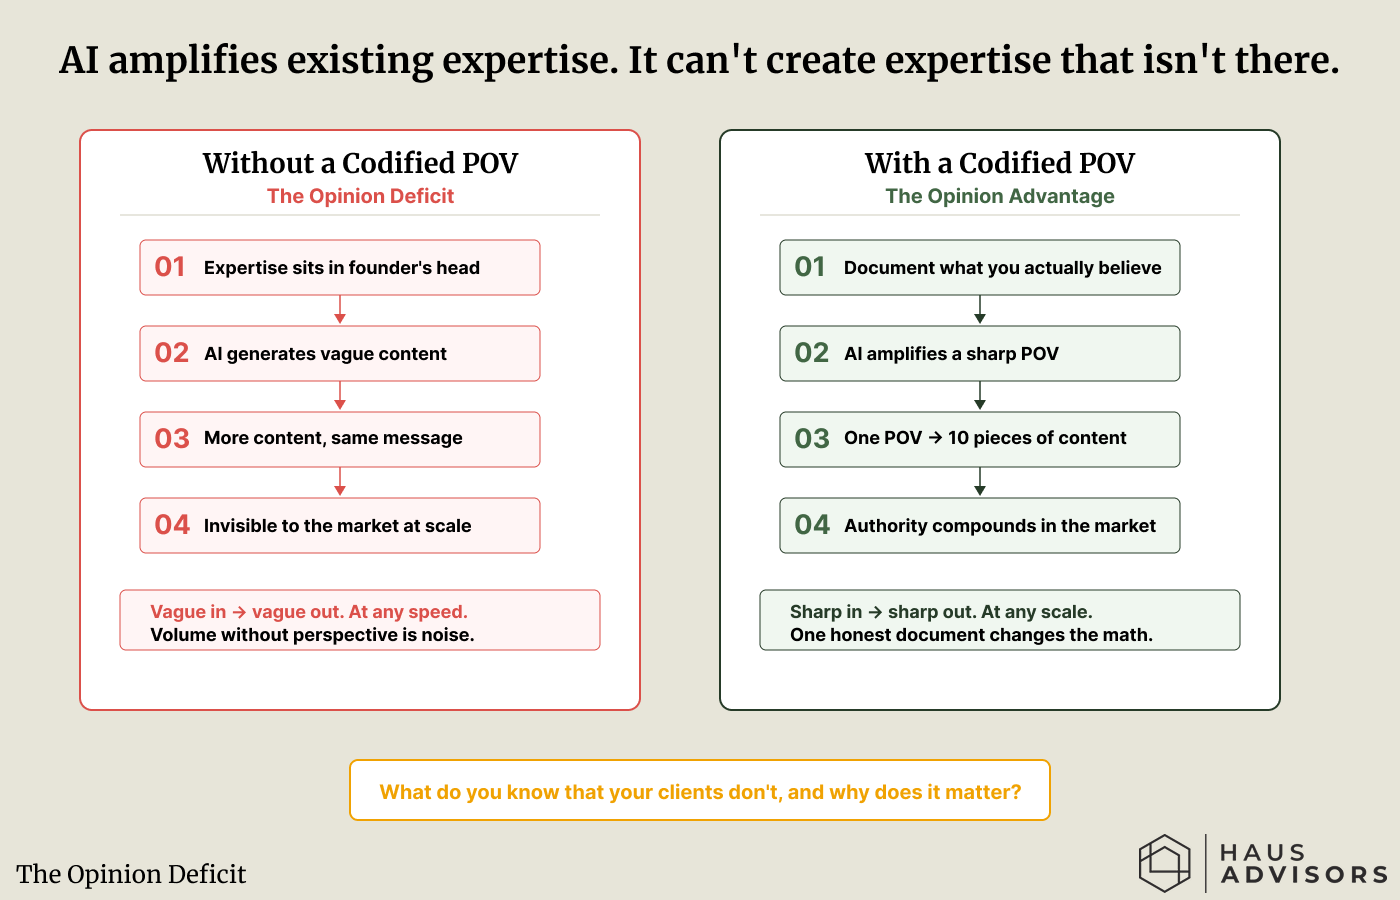
Chart: The Opinion Deficit. AI can multiply a clear point of view, but it can't invent one you never wrote down.
Publishing

The Opinion Deficit

AI can multiply a clear point of view, but it can't invent one you never wrote down.
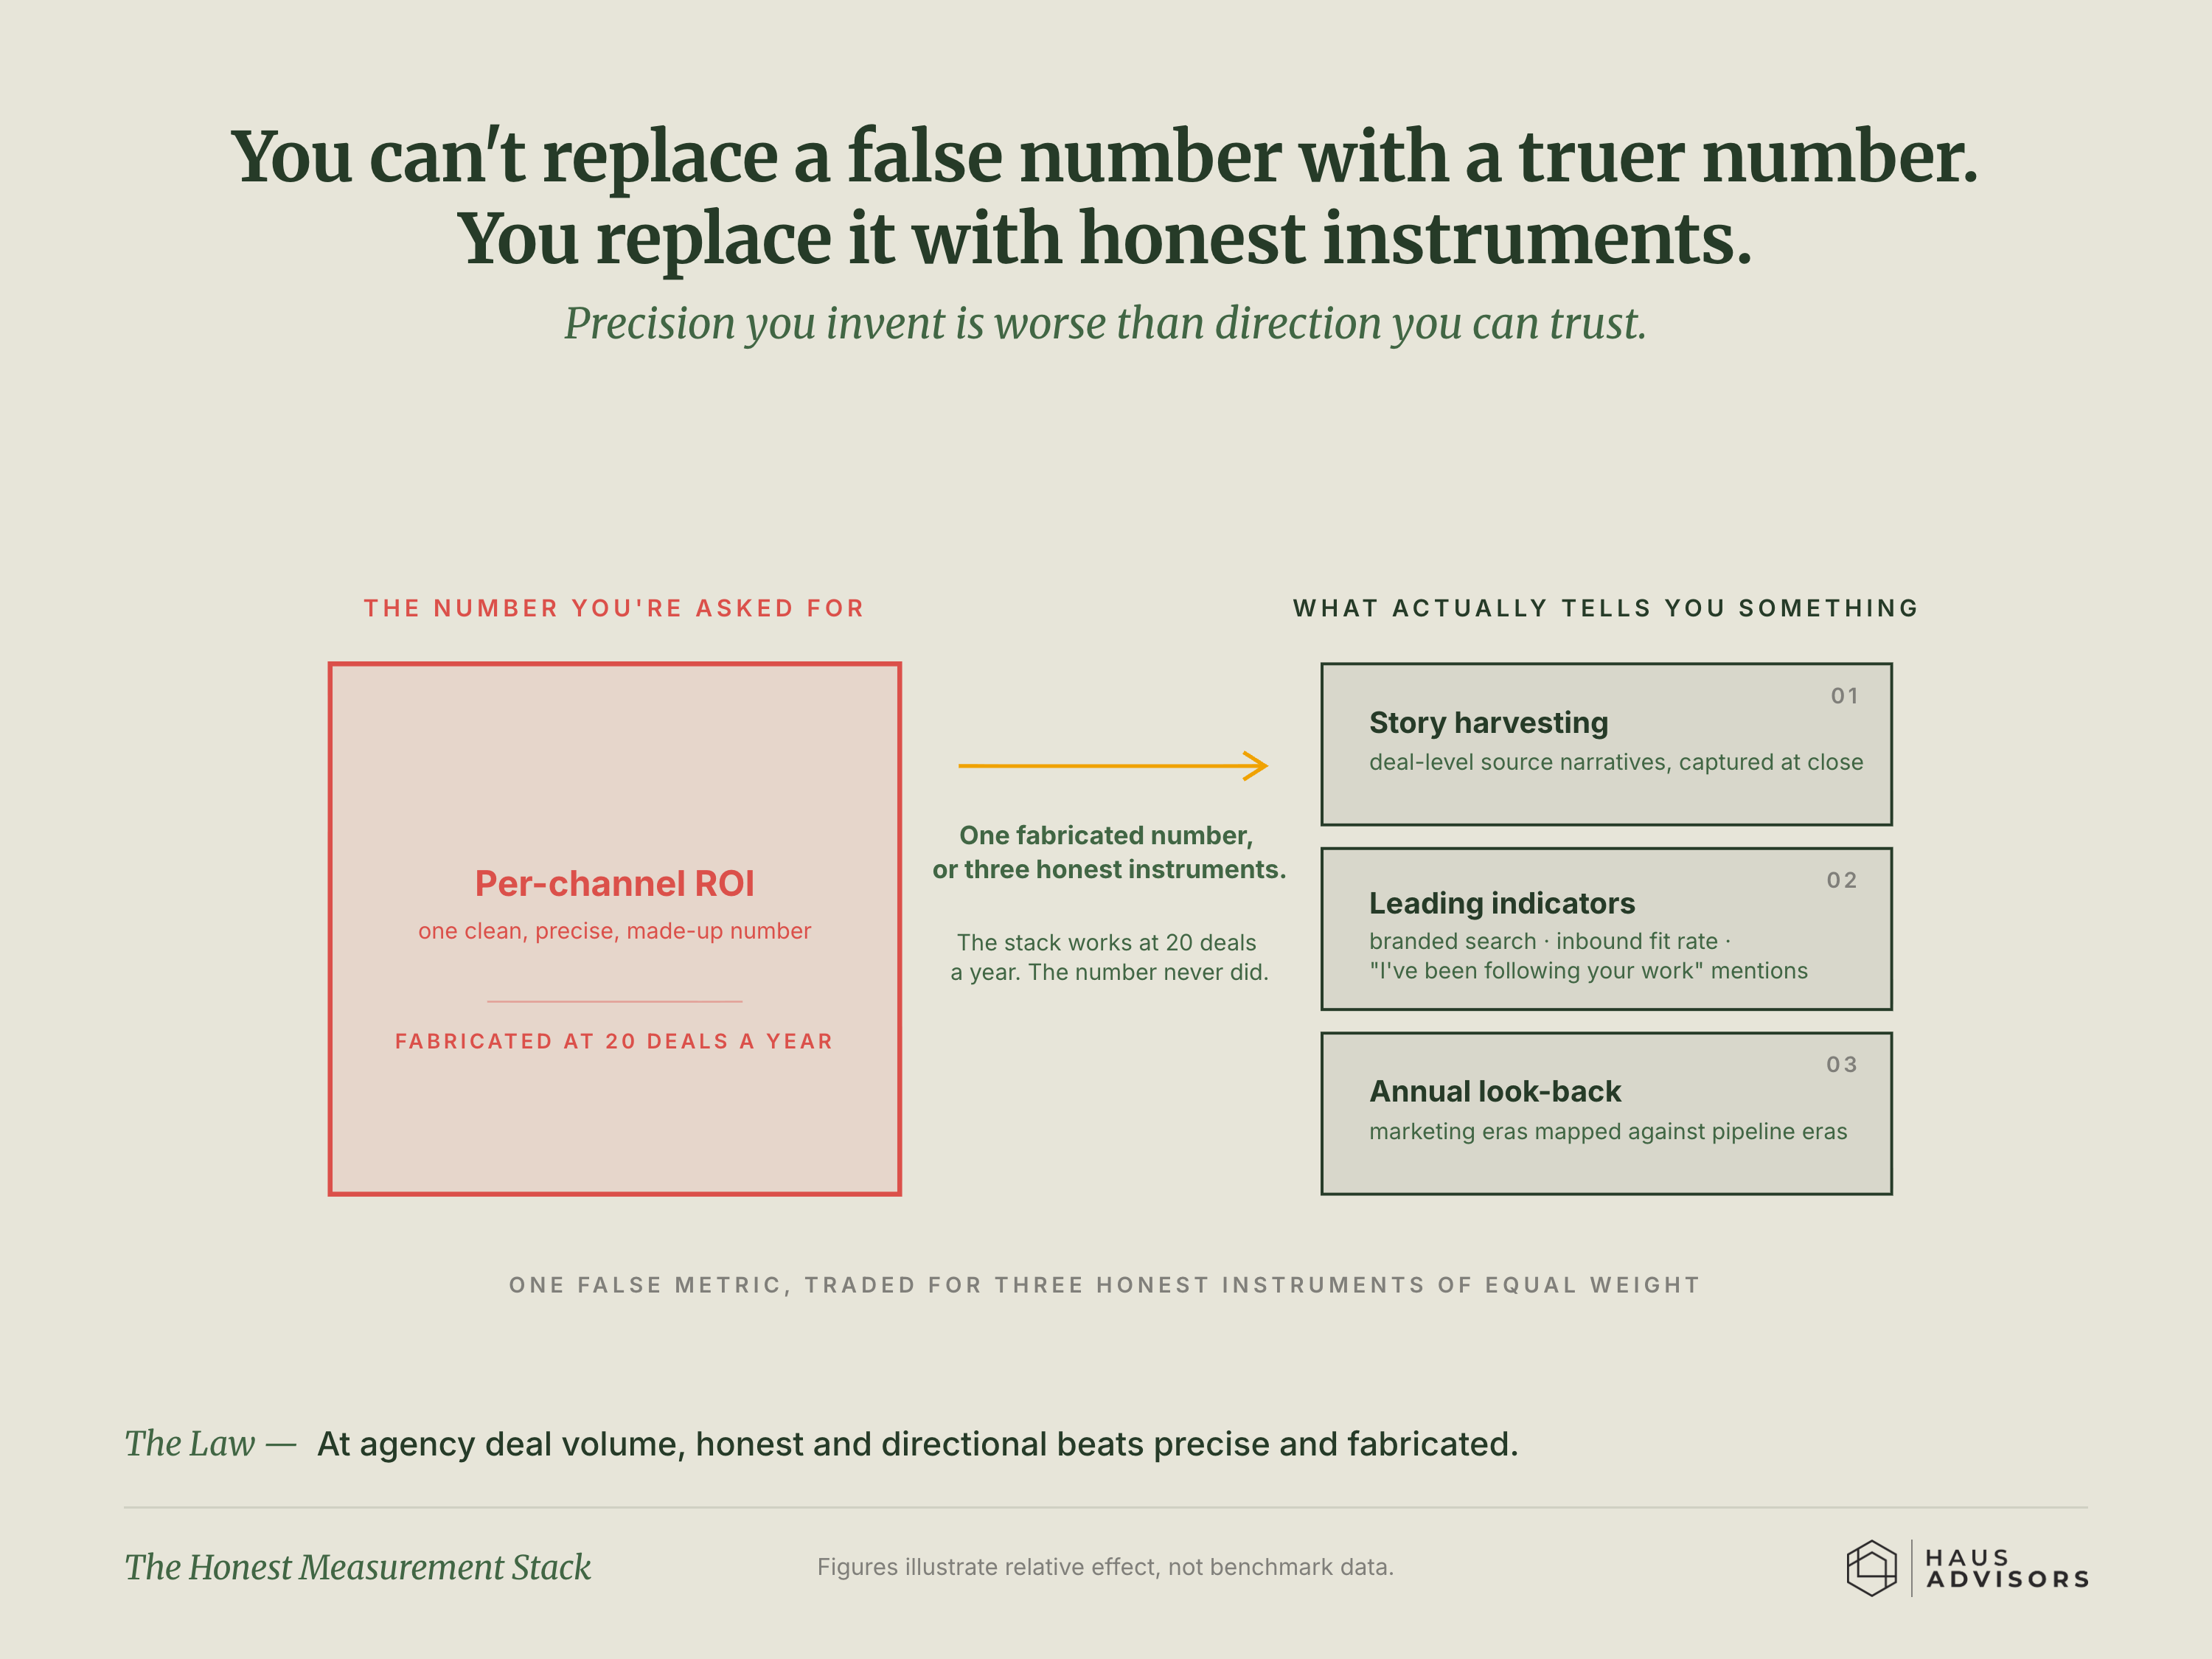
Chart: The Honest Measurement Stack. You can't fix a made-up number by making it more precise - you replace it with honest tools.
Persistence

The Honest Measurement Stack

You can't fix a made-up number by making it more precise - you replace it with honest tools.
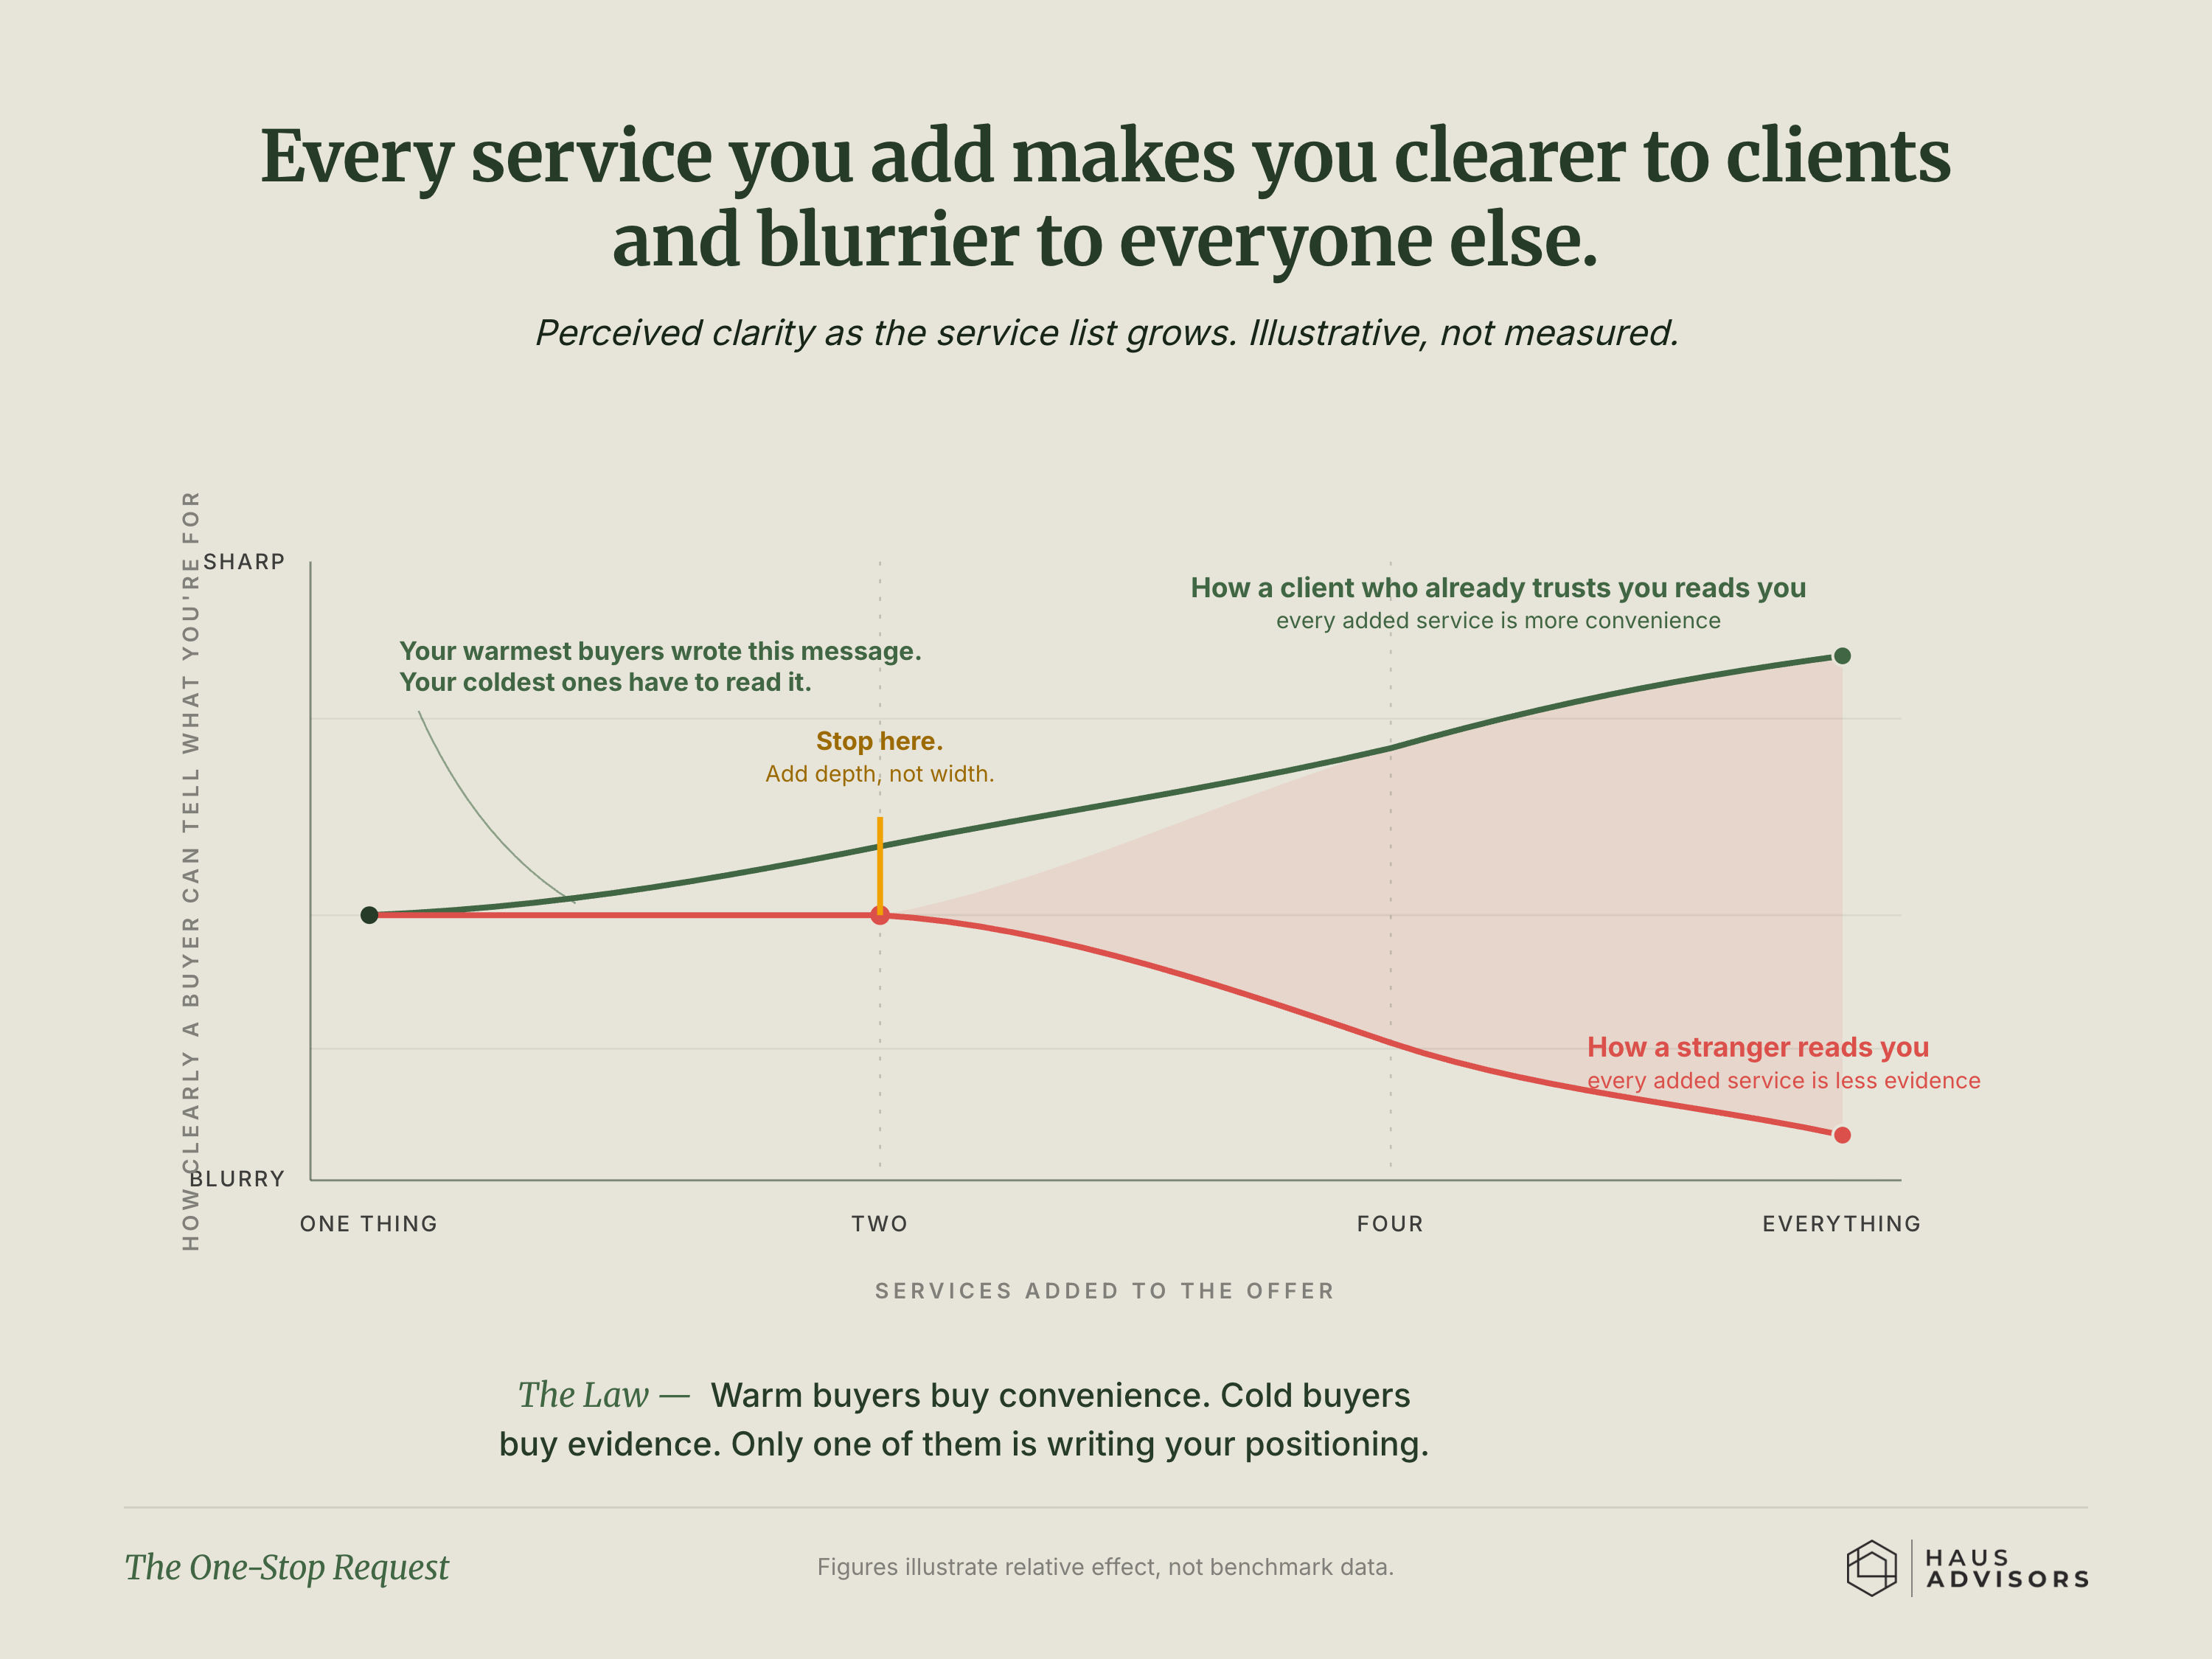
Chart: The One-Stop Request. Every service you add makes you clearer to clients who already trust you and blurrier to everyone who doesn't.
Positioning

The One-Stop Request

Every service you add makes you clearer to clients who already trust you and blurrier to everyone who doesn't.

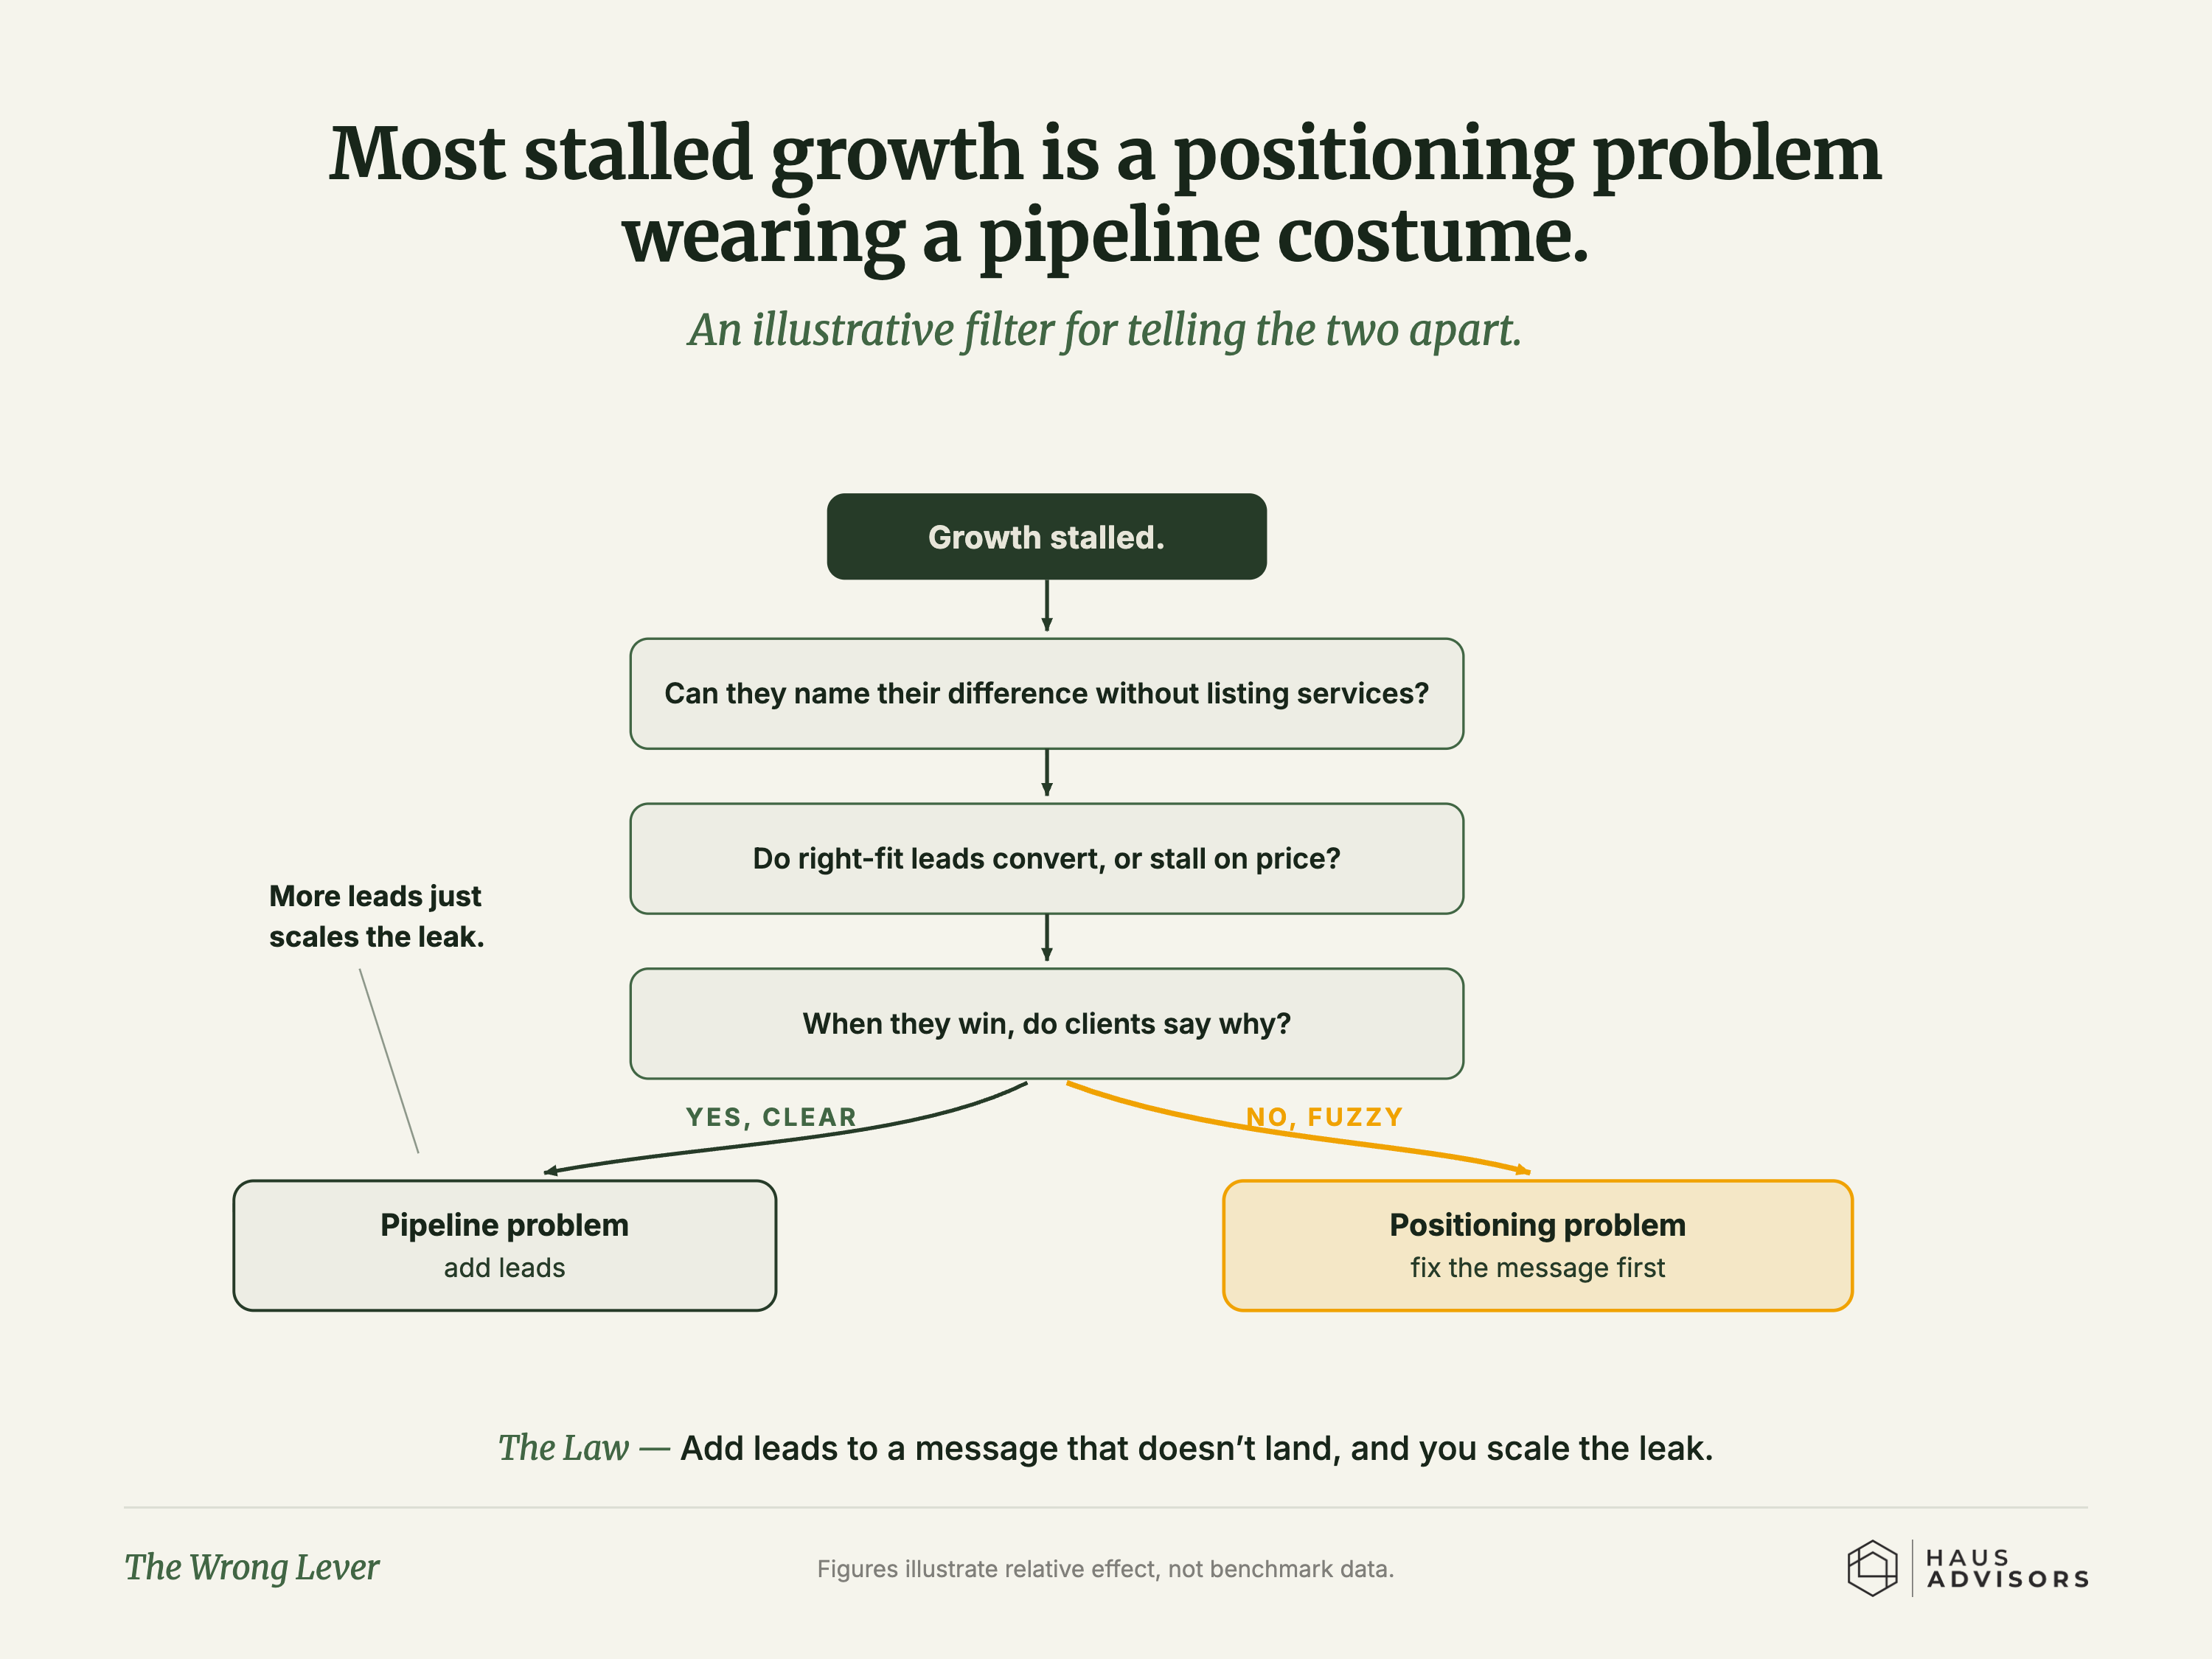
Chart: The Wrong Lever. Most stalled growth is a message problem dressed up as a lead problem.
Positioning

The Wrong Lever

Most stalled growth is a message problem dressed up as a lead problem.

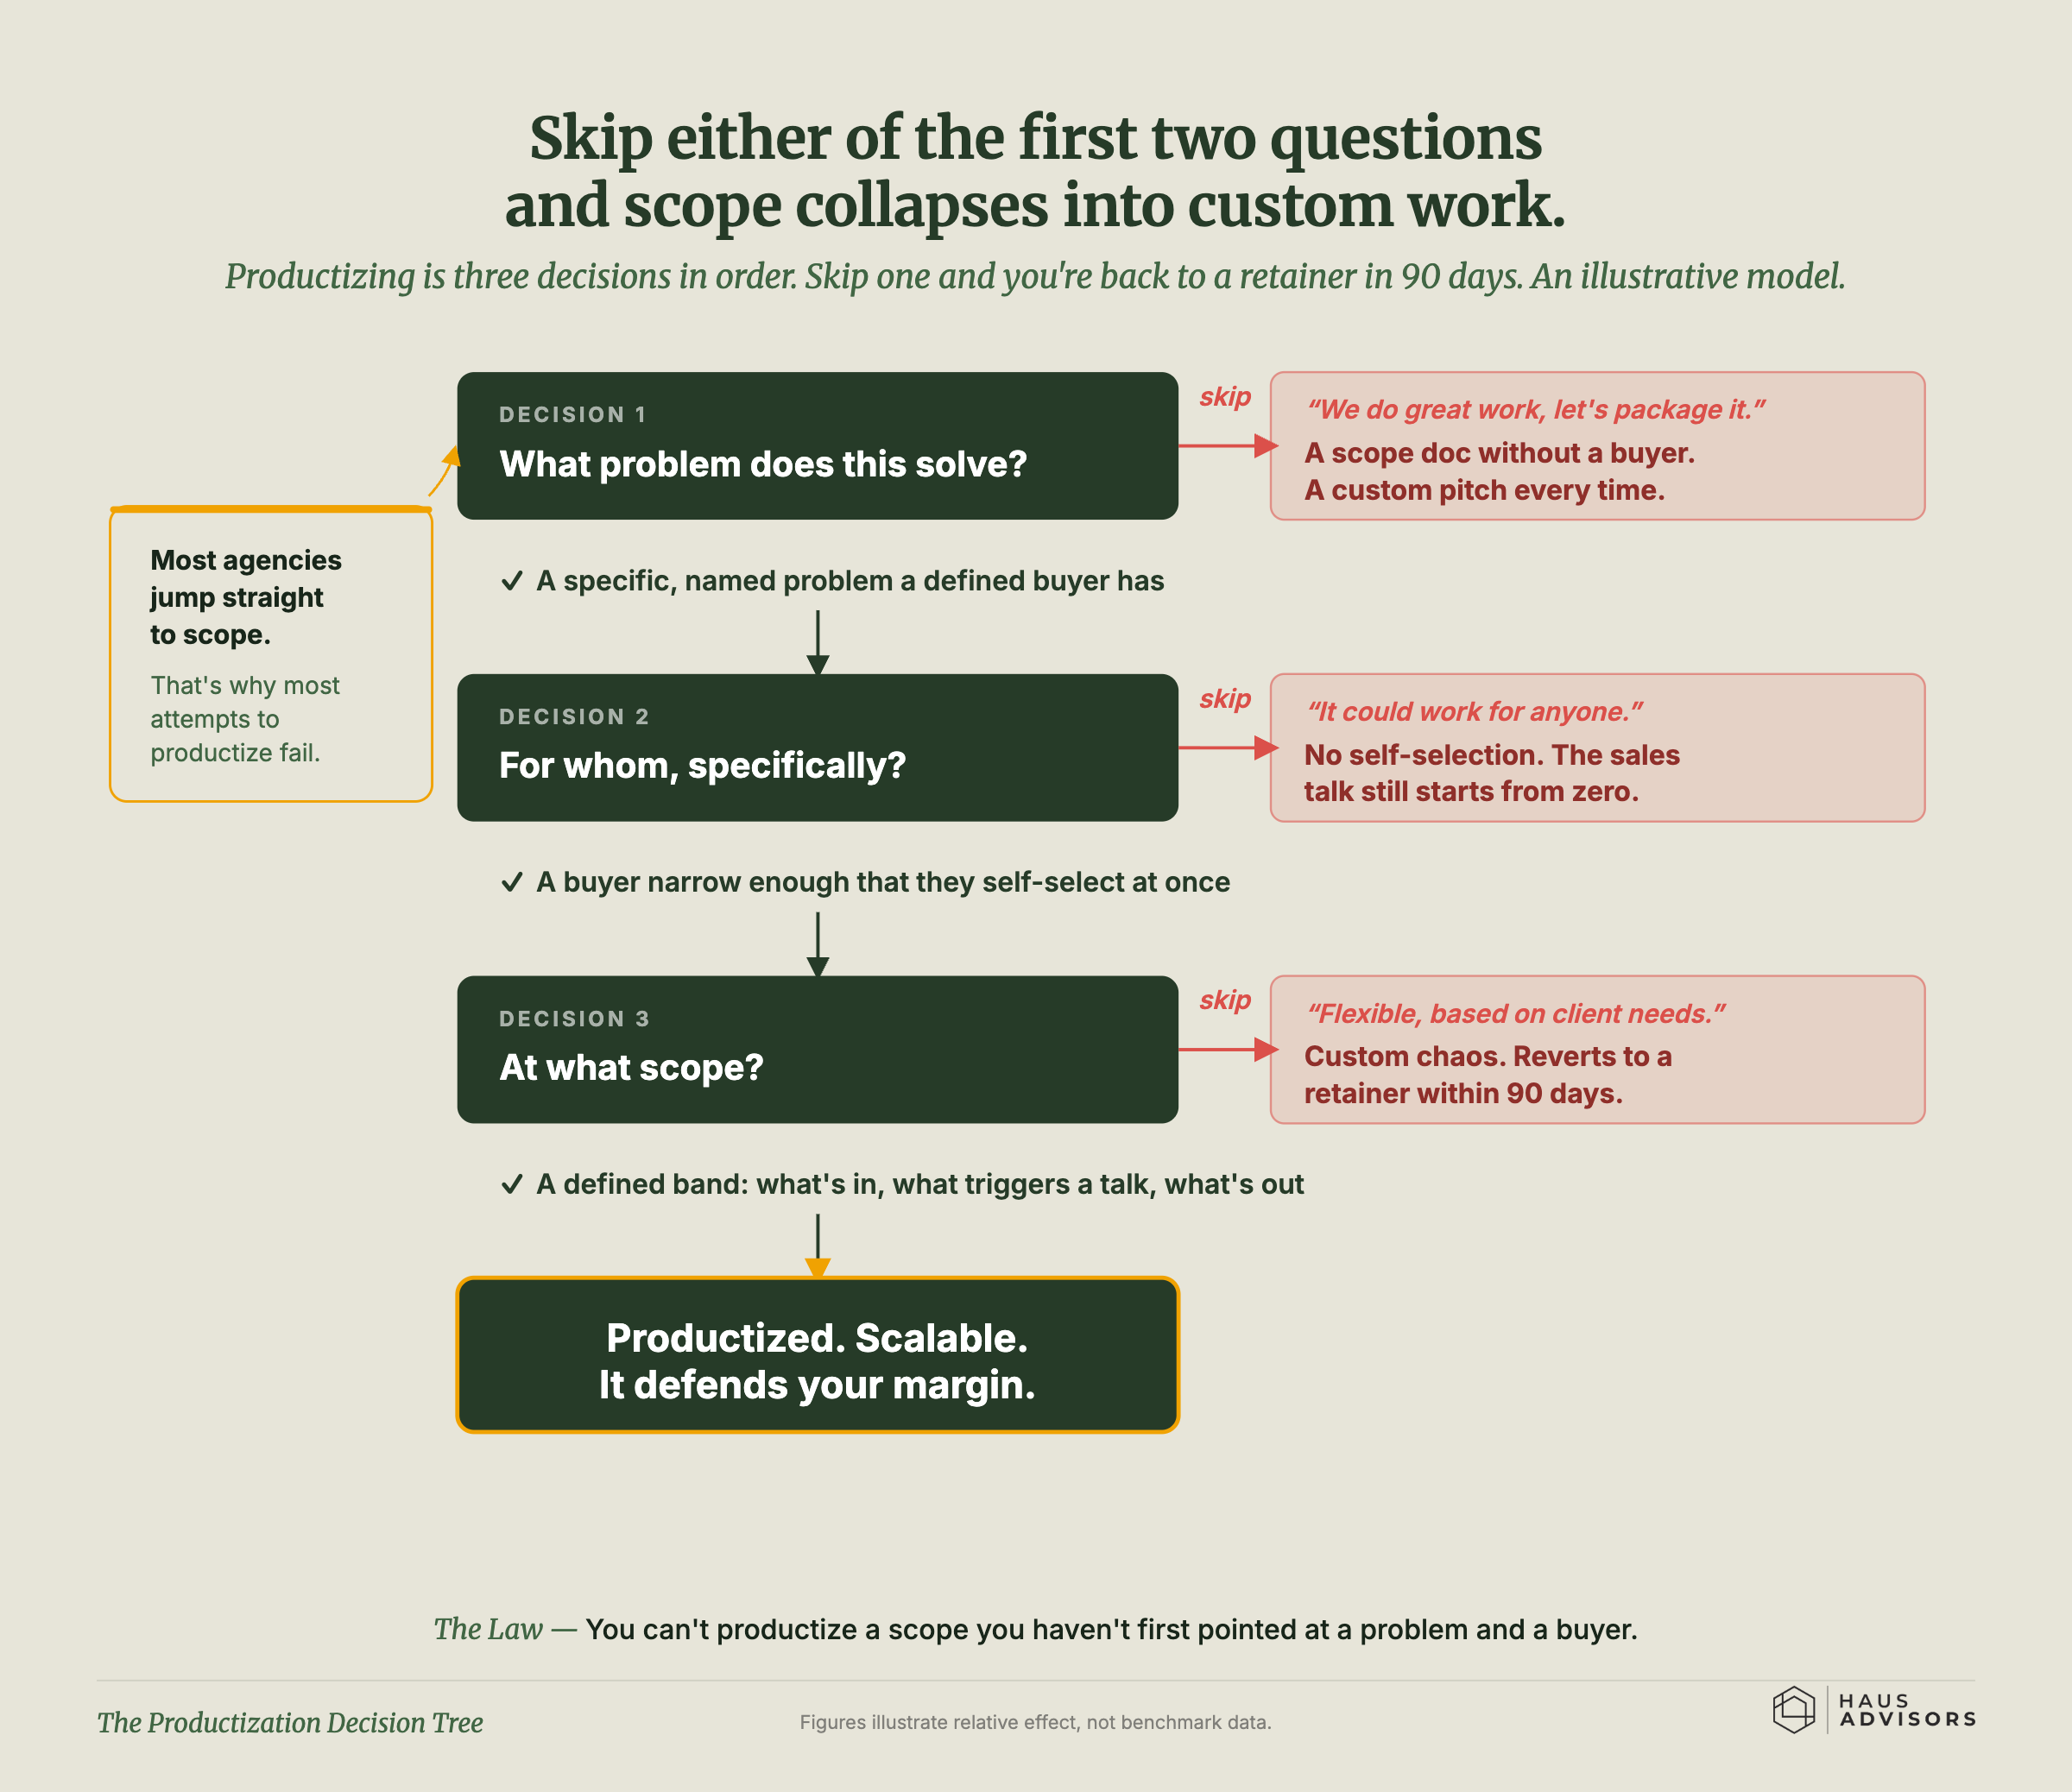
Chart: The Productization Decision Tree. Packaging a service is three decisions made in order, and skipping any one drops you back into custom work.
Productization

The Productization Decision Tree

Packaging a service is three decisions made in order, and skipping any one drops you back into custom work.

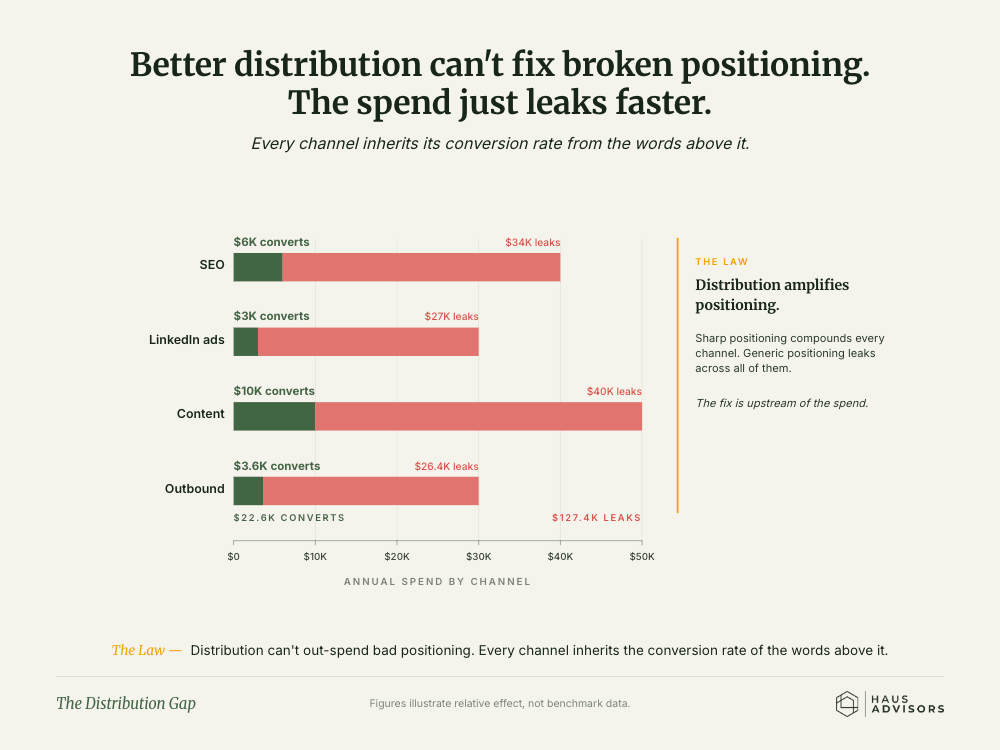
Chart: The Distribution Gap. Spending on more channels can't fix a weak message - it just makes the money leak out faster.
Positioning

The Distribution Gap

Spending on more channels can't fix a weak message - it just makes the money leak out faster.
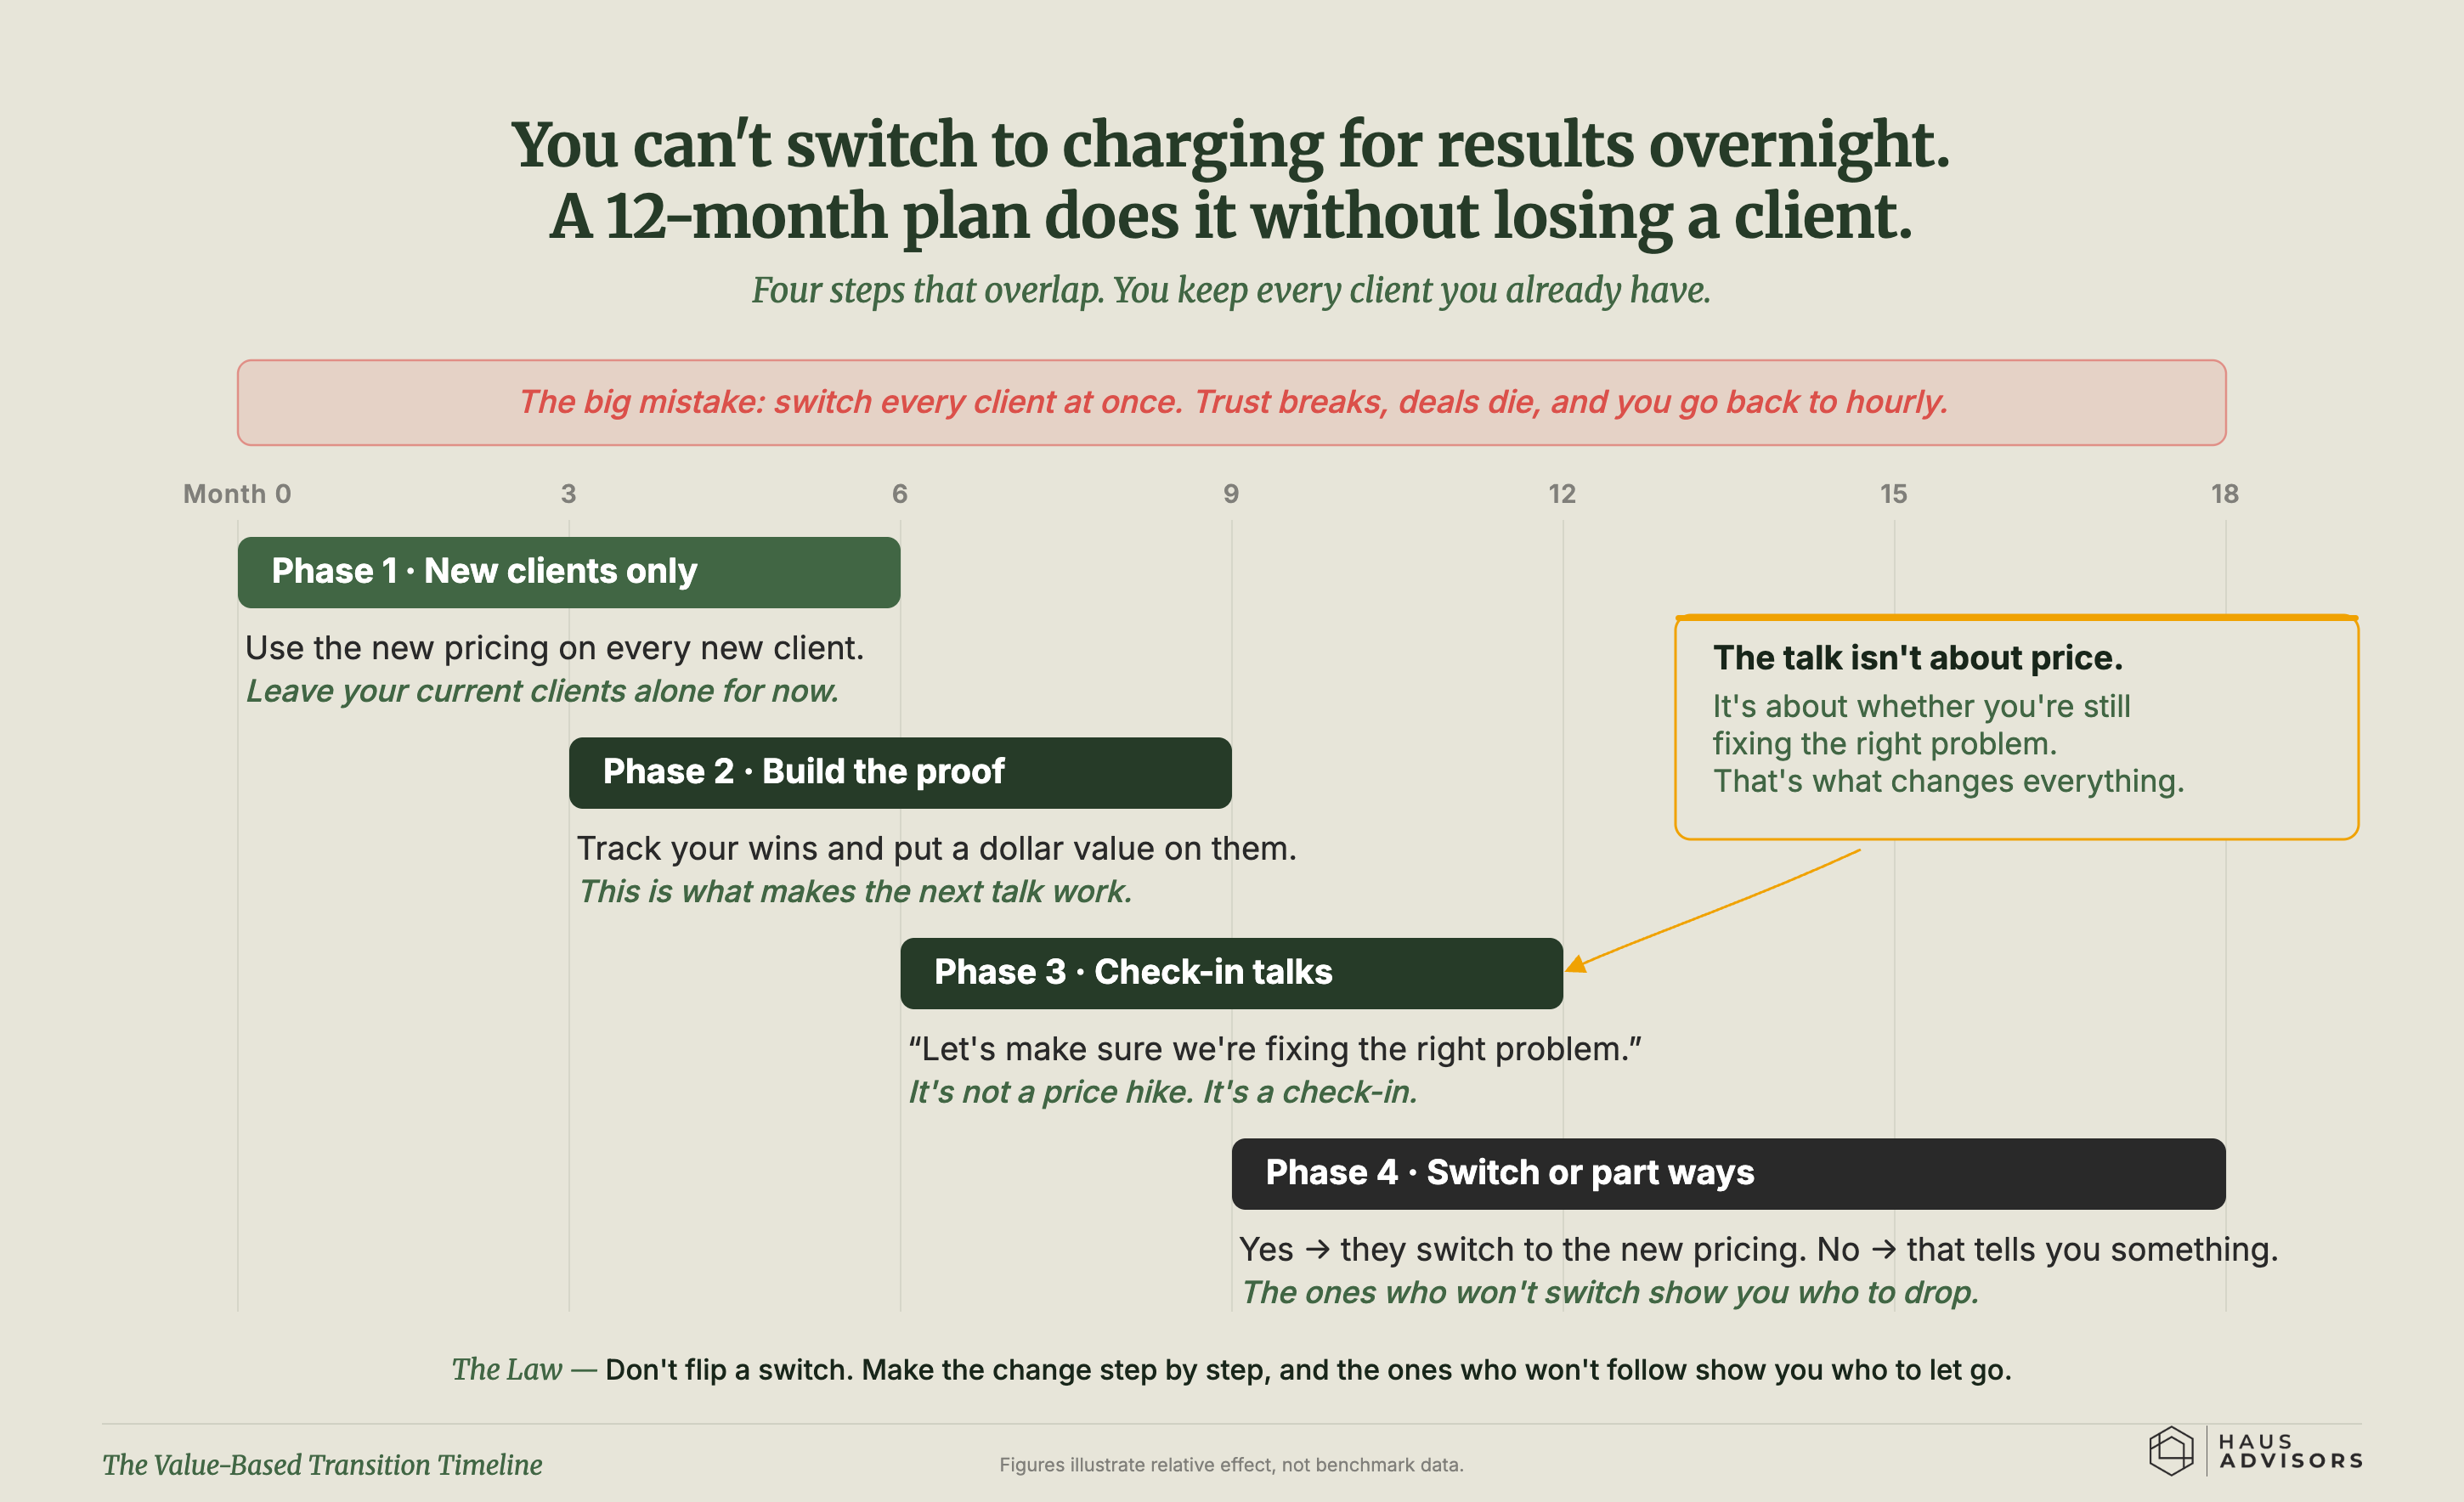
Chart: The Value-Based Transition Timeline. You can't flip to charging for results overnight, but a staged year-long plan gets there without losing clients.
Productization

The Value-Based Transition Timeline

You can't flip to charging for results overnight, but a staged year-long plan gets there without losing clients.